| metric | value |
|---|---|
| area under ROC curve | 0.78 |
| area under precision-recall curve | 0.47 |
| accuracy | 0.63 |
| precision | 0.33 |
| recall | 0.82 |
| f1 score | 0.47 |
| mean log loss | 0.72 |
| gini coefficient | 0.56 |
| brier skill score | 0.16 |
professional occupation
Overview
This model predicts whether a voter works in an office, professional, or technical occupation — a broad white-collar bucket that includes tech, finance, law, marketing, consulting, engineering, science, and medicine.
Trained on survey data, it draws on salary benchmarks, property records, age, and occupational prestige signals.
These scores help organizations understand the professional composition of their target universe for tailored policy messaging.
- approach: boosted tree classifier
- training rows: 9,614
- last updated: 2026-09-07 17:39:36
Validation
Lift Chart
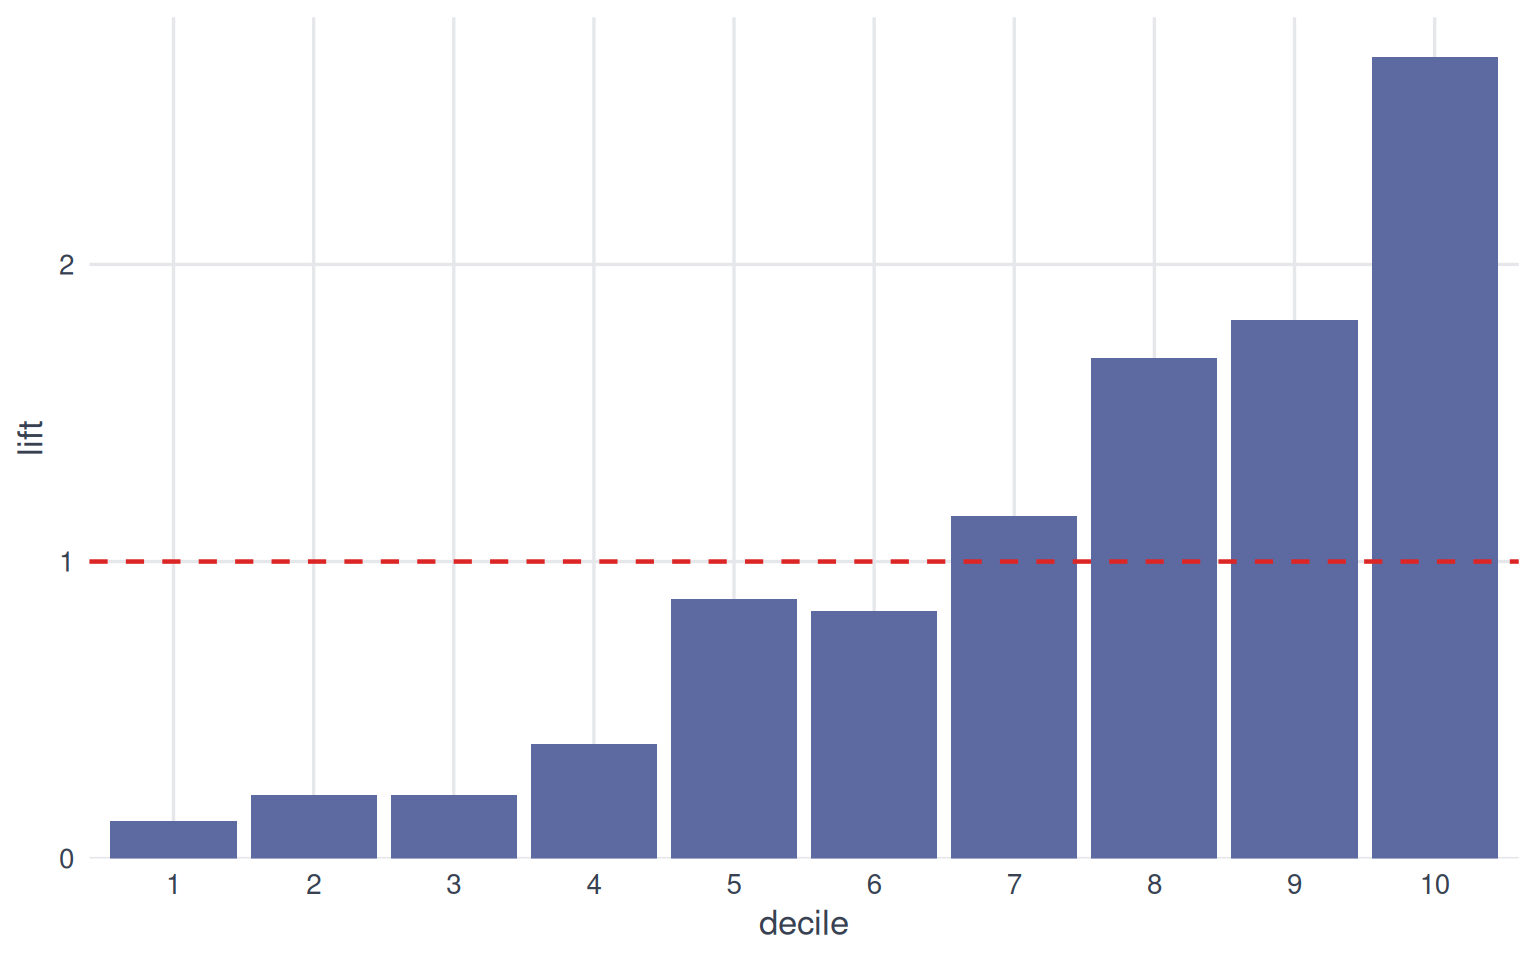
Each bar shows how much more common the outcome is within a score decile than in the population overall. Bars taller than the dashed line (lift of 1) mean the model’s top-ranked groups concentrate the outcome; a steady decline from decile 1 to 10 indicates the model is ranking effectively.
Calibration Plot
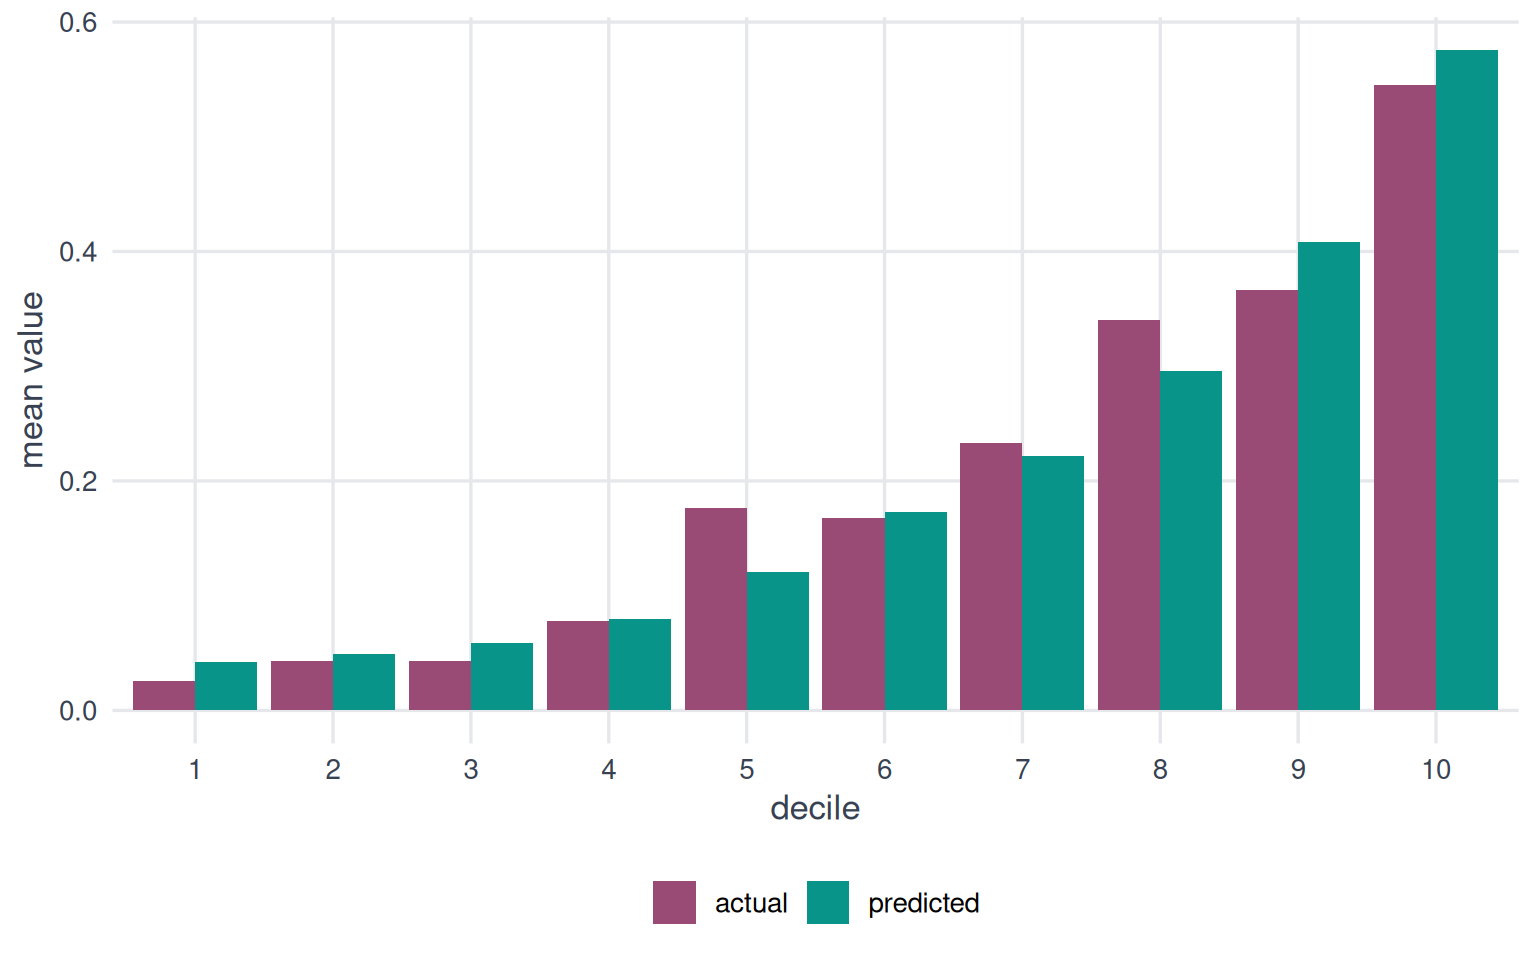
Bars of similar height within each decile indicate well-calibrated predictions. Systematic differences reveal where the model over- or under-predicts.
Cumulative Gains
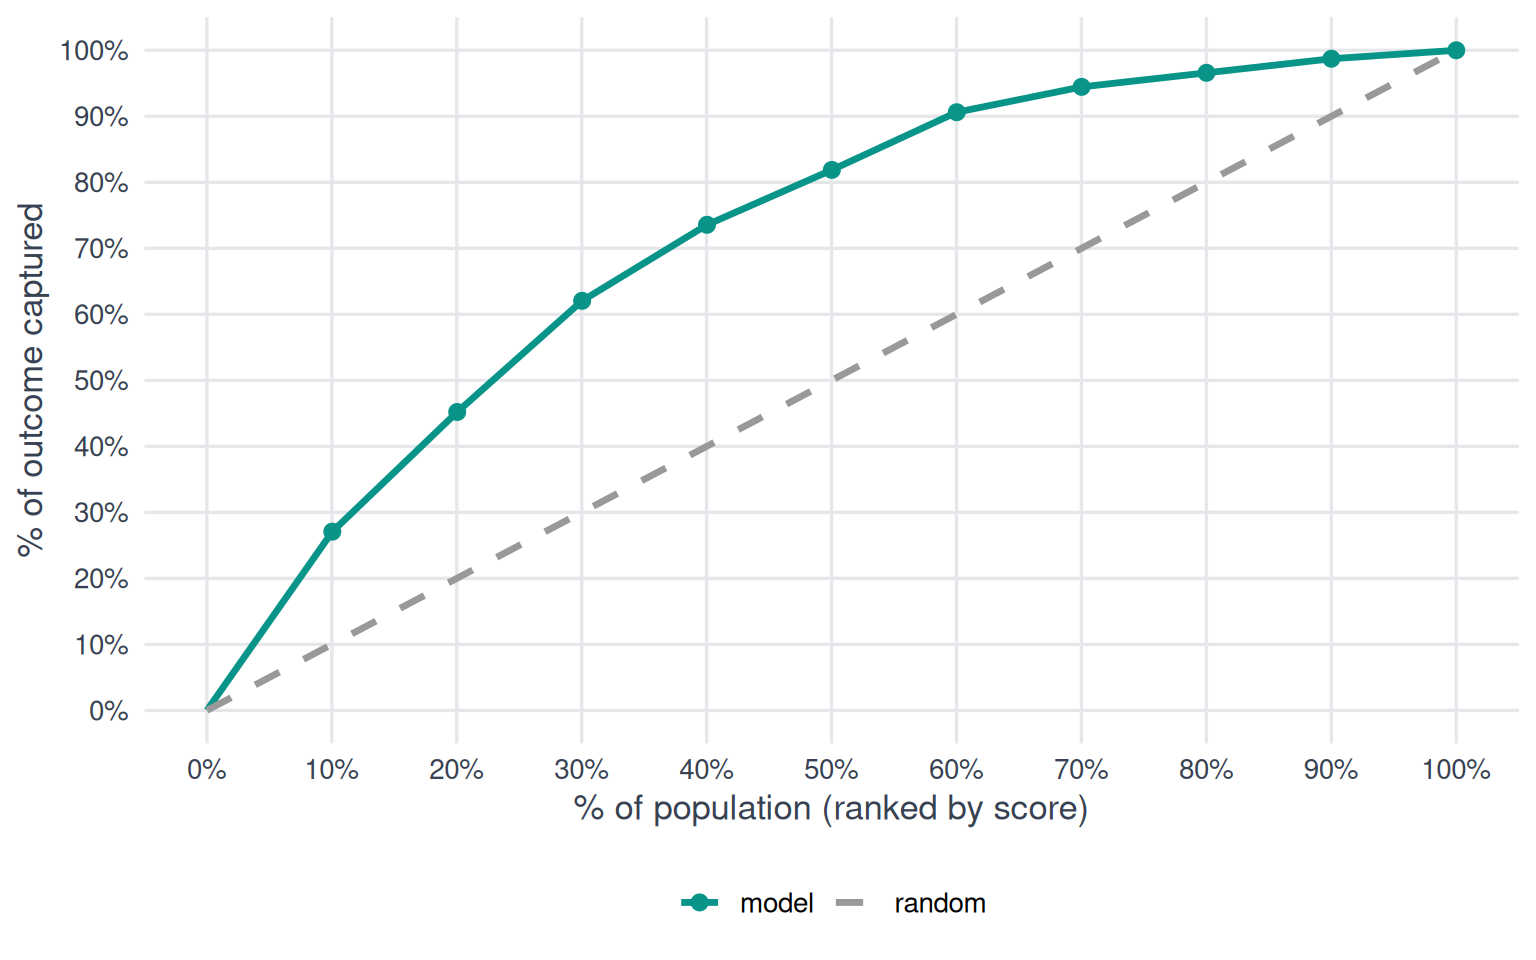
The further the model curve bows above the diagonal, the better the model concentrates the outcome in its top-ranked predictions.
Decile Analysis Table
| decile | count | mean actual | mean predicted | mae | lift |
|---|---|---|---|---|---|
| 10 | 233 | 0.55 | 0.58 | 0.03 | 2.70 |
| 9 | 232 | 0.37 | 0.41 | 0.04 | 1.81 |
| 8 | 232 | 0.34 | 0.30 | 0.04 | 1.69 |
| 7 | 232 | 0.23 | 0.22 | 0.01 | 1.15 |
| 6 | 232 | 0.17 | 0.17 | 0.005 | 0.83 |
| 5 | 232 | 0.18 | 0.12 | 0.06 | 0.87 |
| 4 | 232 | 0.08 | 0.08 | 0.002 | 0.38 |
| 3 | 232 | 0.04 | 0.06 | 0.02 | 0.21 |
| 2 | 232 | 0.04 | 0.05 | 0.006 | 0.21 |
| 1 | 232 | 0.03 | 0.04 | 0.02 | 0.13 |
Architecture
This model is a boosted-tree classifier trained with BigQuery ML.
Hyperparameter configuration
- max iterations: 20
- learn rate: 0.0497
- l1 regularization: 1e-14
- l2 regularization: 4.547e-13
- min relative progress: 0.01
- early stop: TRUE
- input label columns: employment_type_professional
- data split method: AUTO_SPLIT
- num trials: 12
- max parallel trials: 4
- hparam tuning objectives: ROC_AUC
- enable global explain: TRUE
- auto class weights: FALSE
- max tree depth: 3
- subsample: 0.4121
- min split loss: 0
- category encoding method: LABEL_ENCODING
- booster type: GBTREE
- num parallel tree: 1
- tree method: AUTO
- min tree child weight: 1
- instance weight column: sample_weight
- xgboost version: 0.9
Features
Importance
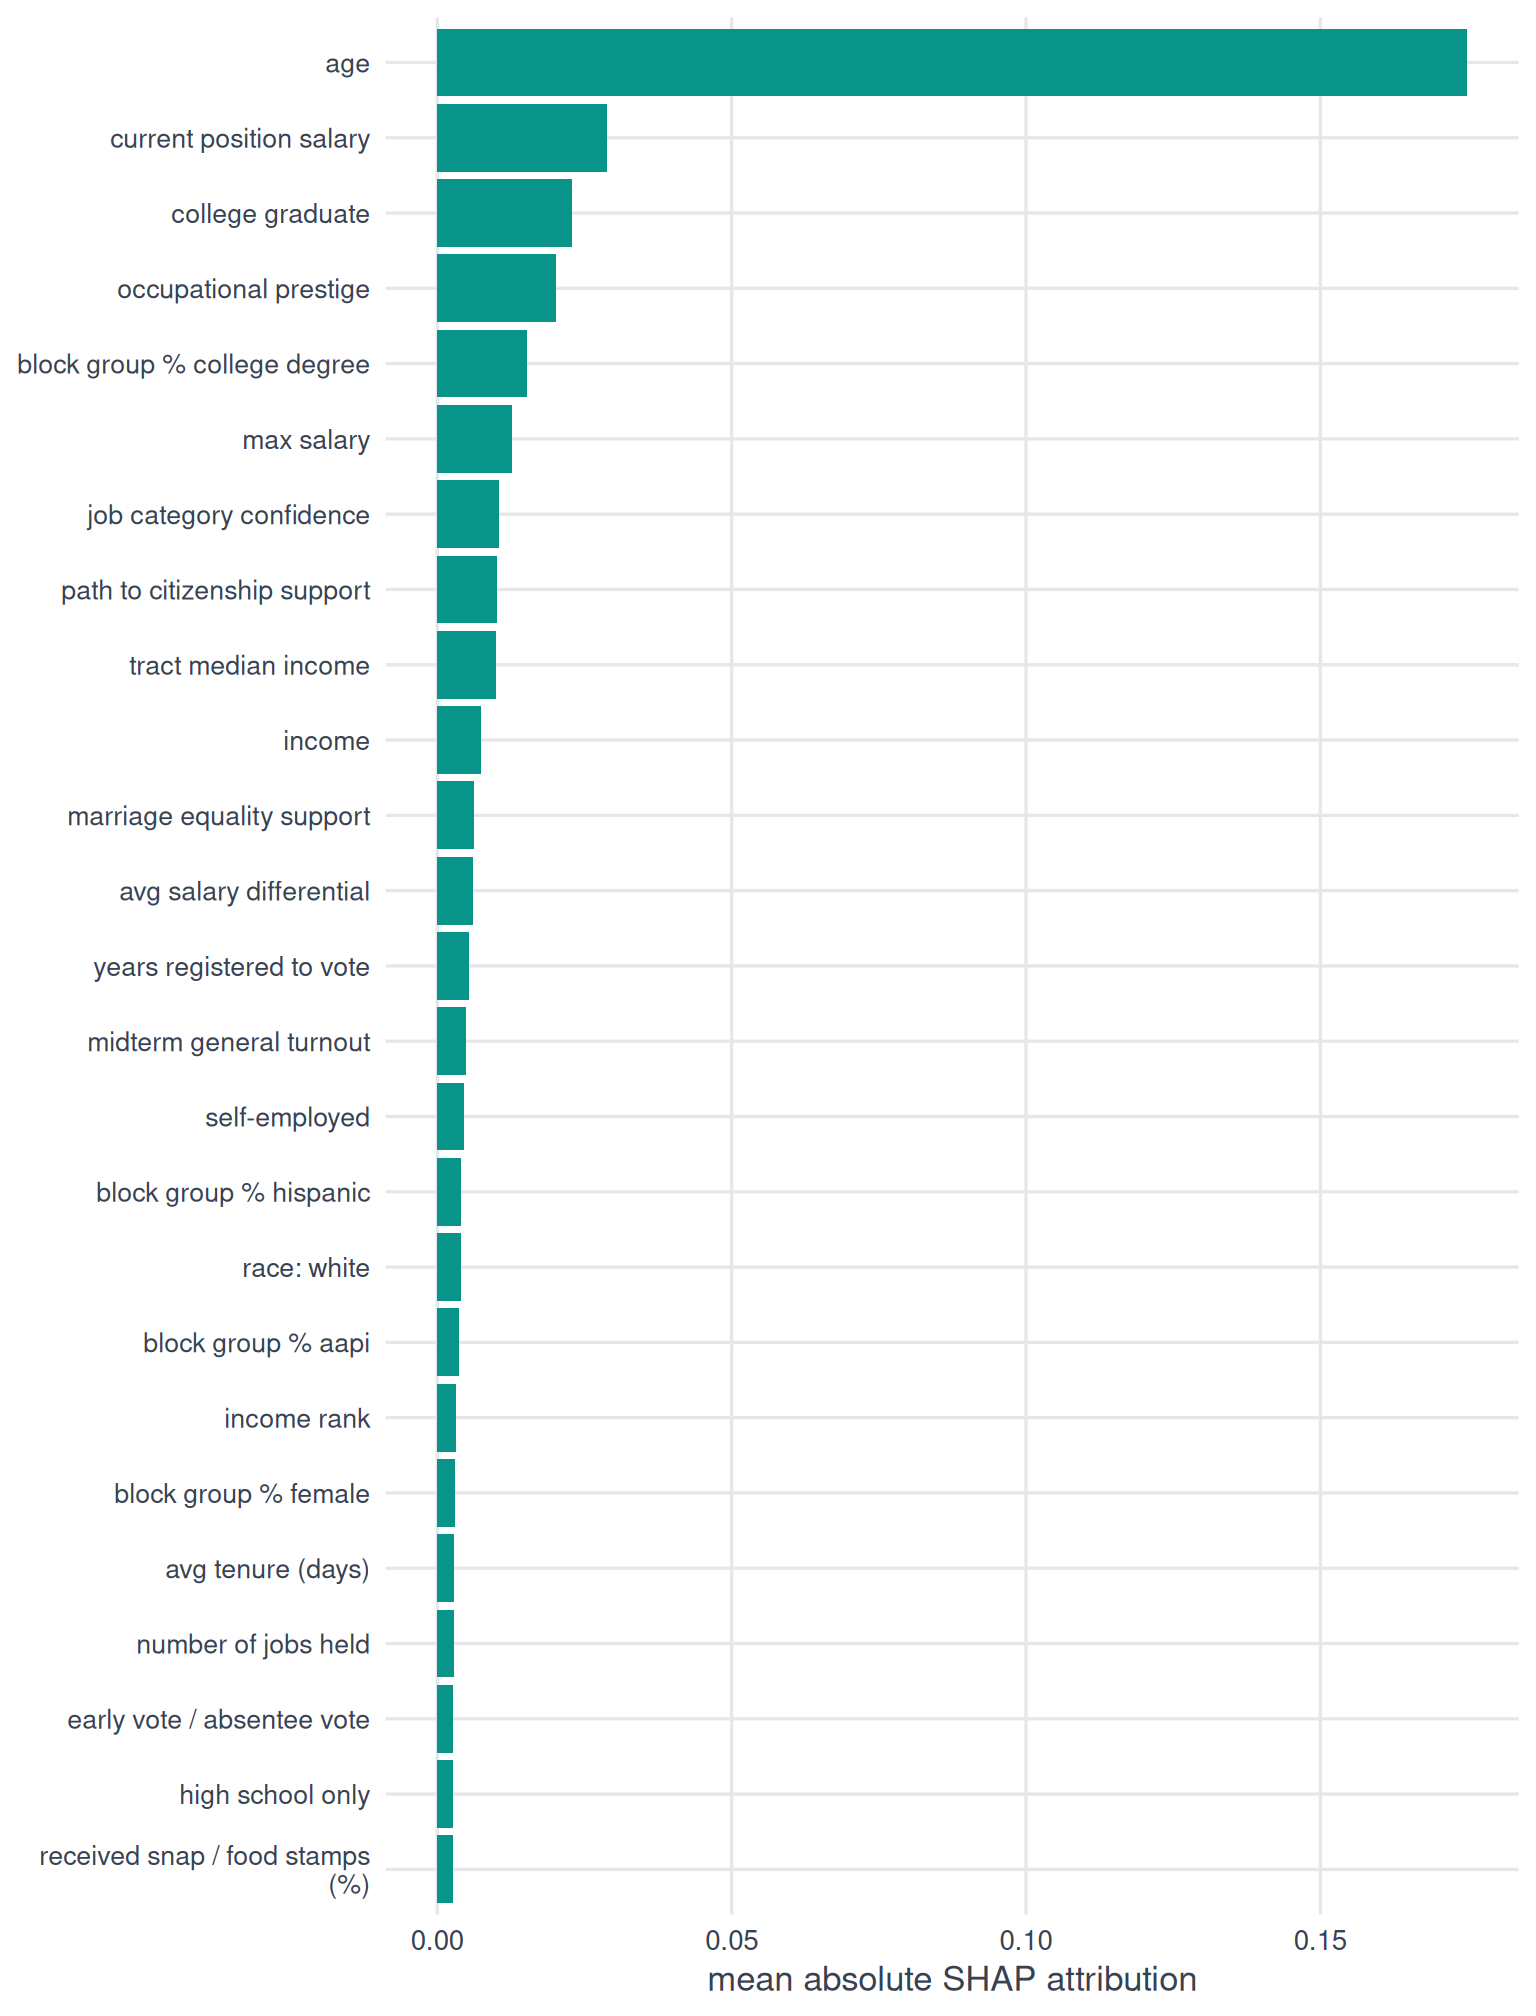
Interaction terms are split evenly between the features they combine.
Sourcing
Agency for Healthcare Research and Quality
- received snap / food stamps (%)
Revelio Labs
- avg salary differential
- avg tenure (days)
- current position salary
- job category confidence
- max salary
- number of jobs held
- occupational prestige score
State voter files (via TargetSmart)
- age
- years registered to vote
TargetSmart
- college graduate score
- early vote / absentee vote score
- high school only score
- income rank
- marriage equality support score
- midterm general turnout score
- path to citizenship support score
- race: white
U.S. Census American Community Survey
- block group % aapi
- block group % college degree
- block group % female
- block group % hispanic
- tract median income
Verisk (via TargetSmart)
- income
- self-employed
Implementation
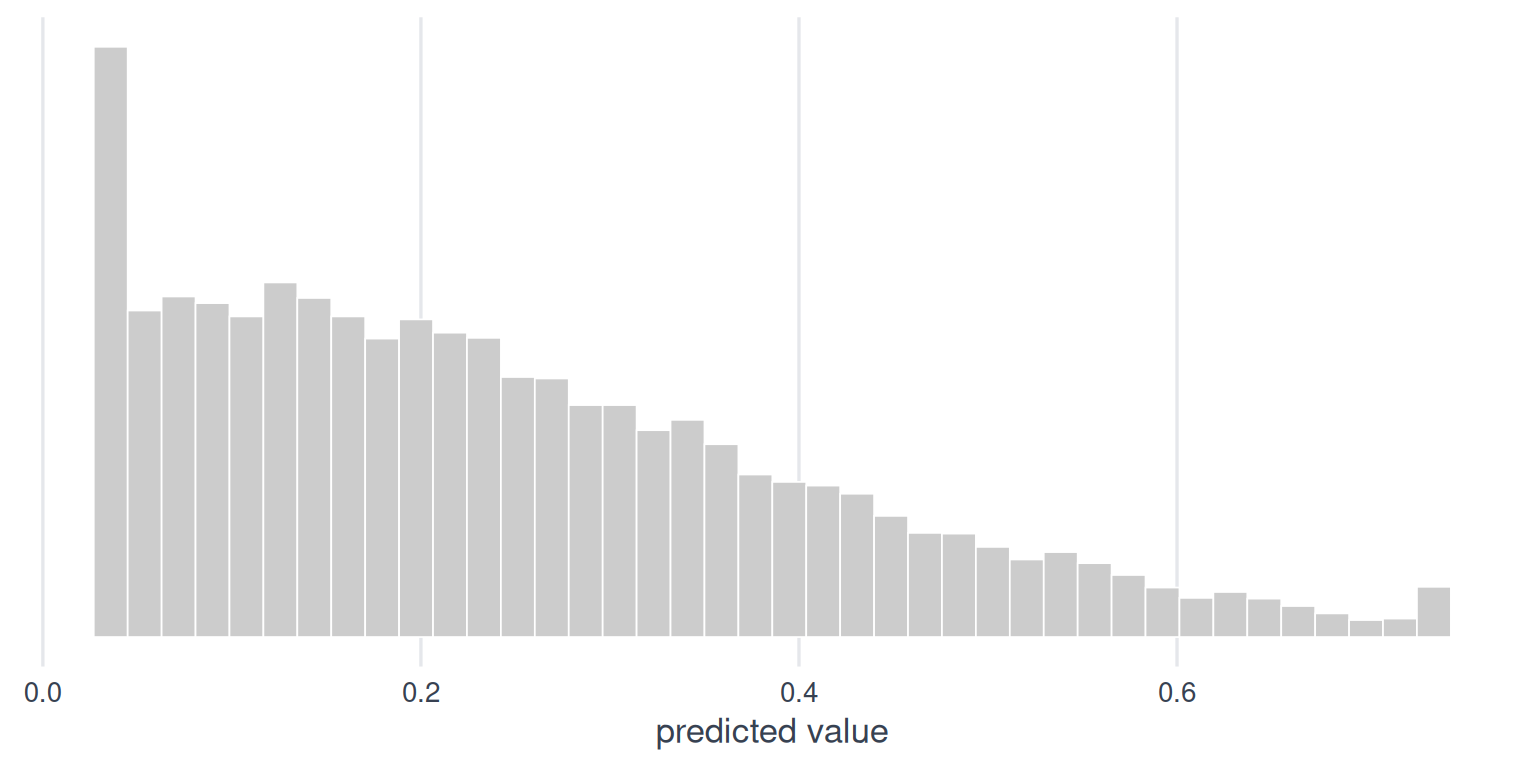
Prediction distribution
| statistic | value |
|---|---|
| mean | 0.25 |
| std dev | 0.17 |
| min | 0.04 |
| 25th | 0.10 |
| median | 0.21 |
| 75th | 0.34 |
| max | 0.74 |
Segments
| segment | lowest score | highest score | share of records |
|---|---|---|---|
| Most likely | 0.35 | 0.74 | 24.7% |
| Somewhat likely | 0.22 | 0.34 | 23.3% |
| Least likely | 0.04 | 0.21 | 52.0% |
External validity
Our model indicates that 25% of people with scored records work in an office, professional, or technical occupation (tech, finance, law, marketing, consulting, engineering, science, medicine). According to the 2024 ACS 1-year PUMS, ~27% of U.S. adults (~71M) are employed in a role that we consider to be ‘professional.’ (To aggregate up to this category, we combined counts for BLS SOC major groups 11 (management), 13 (business & finance), 15 (computer & math), 17 (architecture/engineering), 19 (sciences), 21 (community & social service), 25 (education, excl. teaching assistants), 27 (arts/media), and 29 (healthcare practitioners), plus protective-service supervisors and fire/law enforcement (33-1/2/3), lawyers and judges (23-1), and non-retail sales reps and supervisors (41-1012, 41-3, 41-4, 41-9021/22, 41-9031).