| metric | value |
|---|---|
| area under ROC curve | 0.75 |
| area under precision-recall curve | 0.17 |
| accuracy | 0.55 |
| precision | 0.12 |
| recall | 0.86 |
| f1 score | 0.21 |
| mean log loss | 0.93 |
| gini coefficient | 0.50 |
| brier skill score | 0.06 |
enrolled in snap
Overview
This model predicts whether a voter participates in the Supplemental Nutrition Assistance Program (SNAP).
Trained on survey data, it draws on working-class indicators, neighborhood income levels, and household characteristics to estimate enrollment likelihood.
These scores help organizations identify voters who depend on food assistance and target outreach around nutrition benefits and anti-hunger policy.
- approach: deep learning
- training rows: 5,026
- last updated: 2026-05-02 16:17:23
Validation
Lift Chart
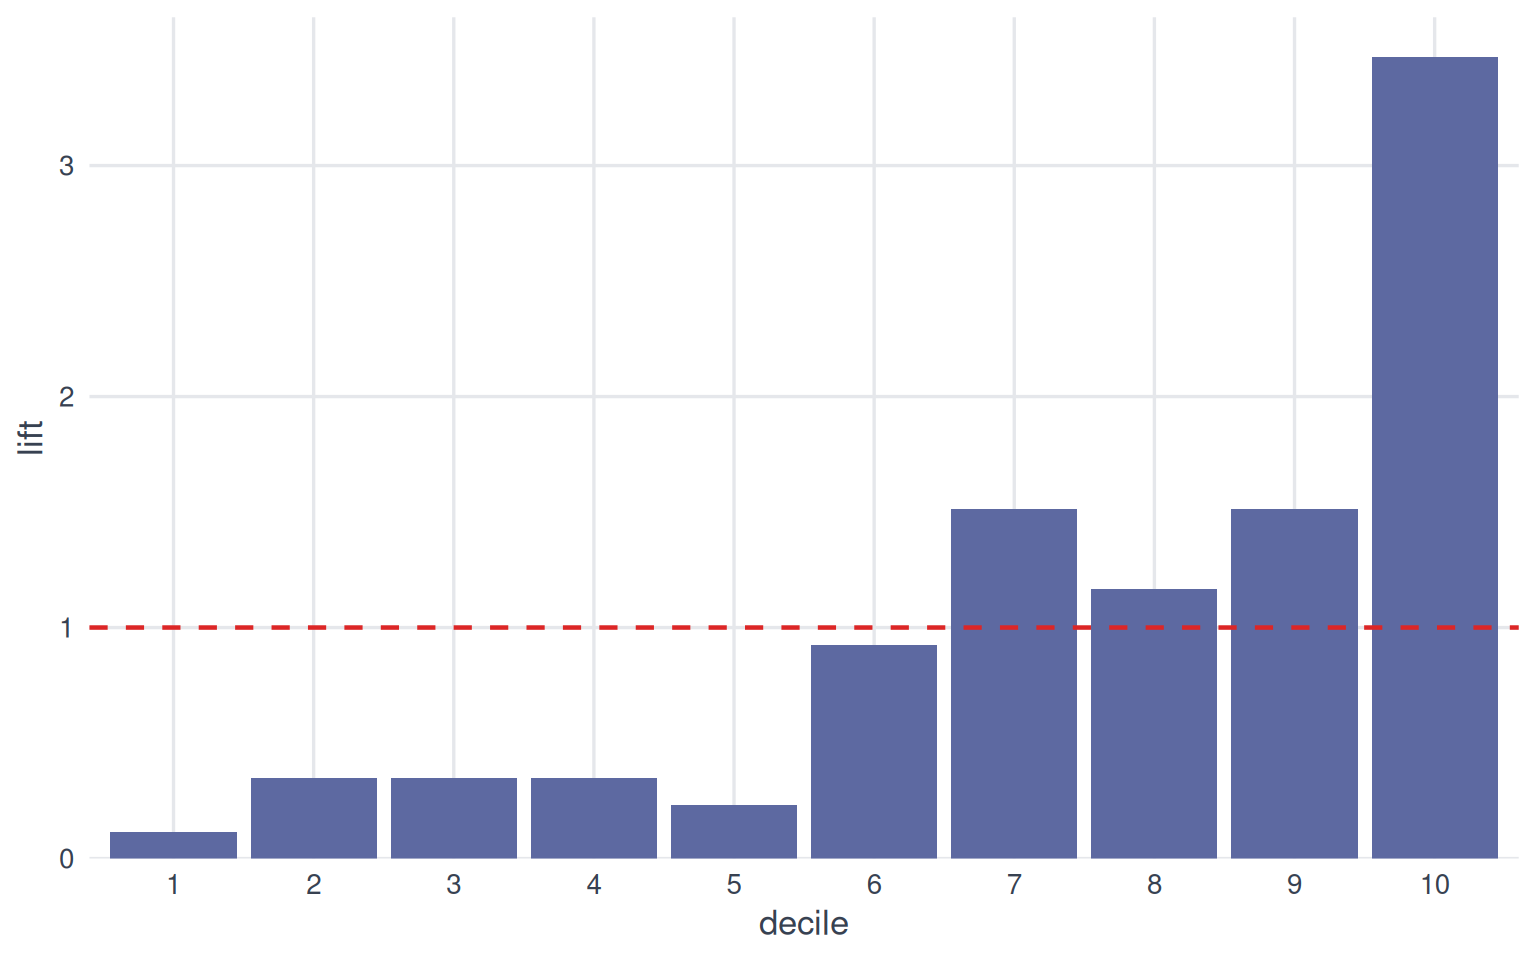
Each bar shows how much more common the outcome is within a score decile than in the population overall. Bars taller than the dashed line (lift of 1) mean the model’s top-ranked groups concentrate the outcome; a steady decline from decile 1 to 10 indicates the model is ranking effectively.
Calibration Plot
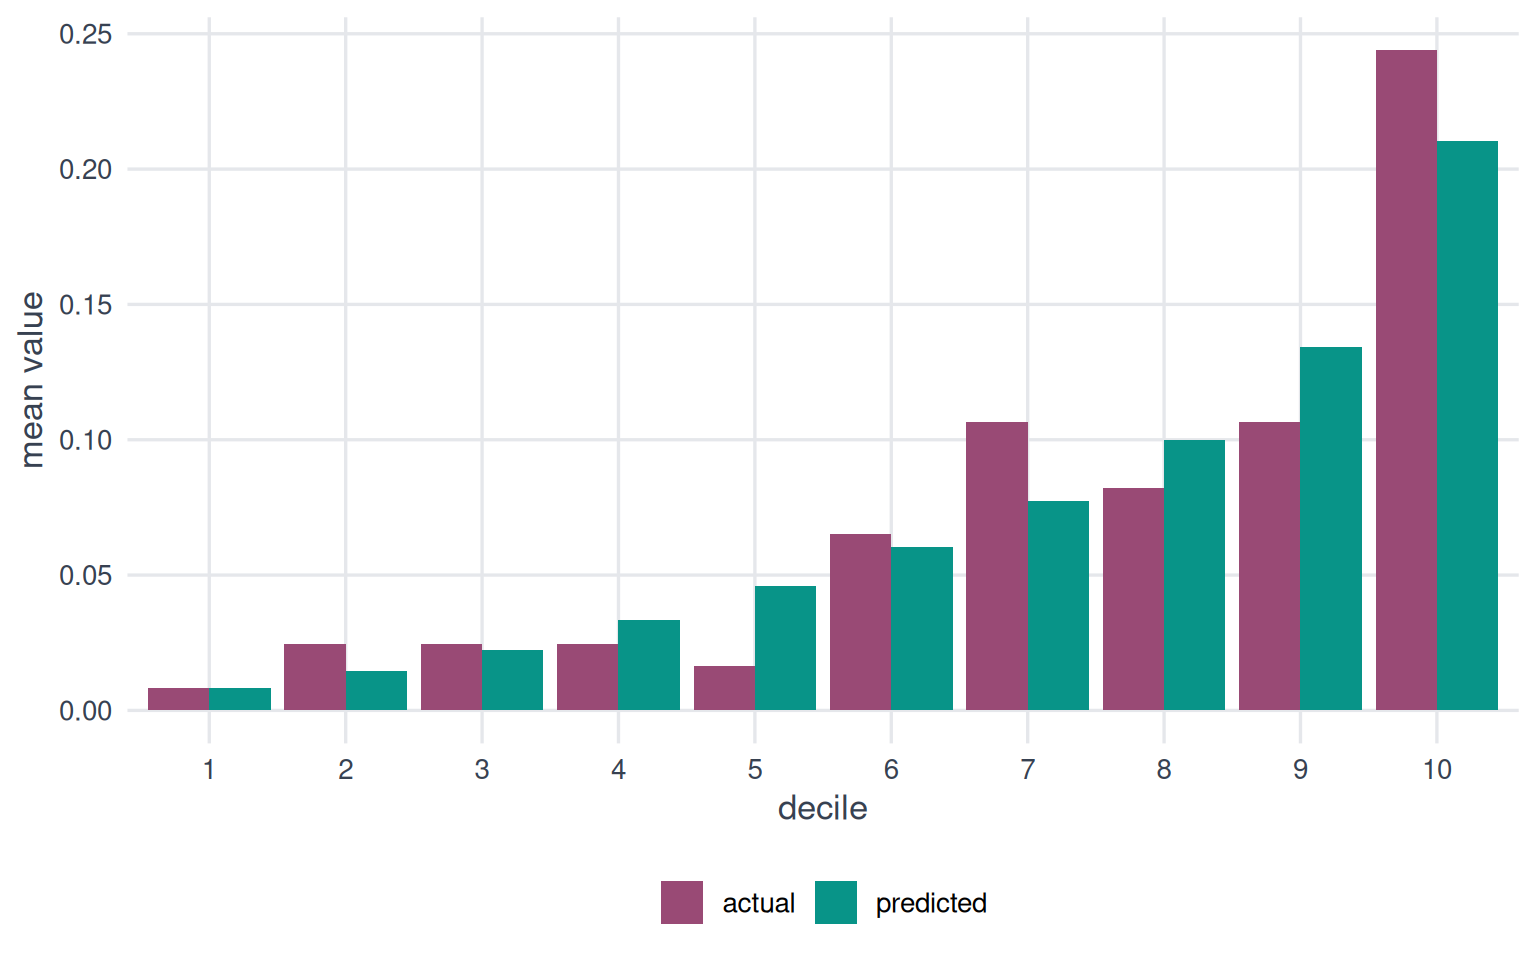
Bars of similar height within each decile indicate well-calibrated predictions. Systematic differences reveal where the model over- or under-predicts.
Cumulative Gains
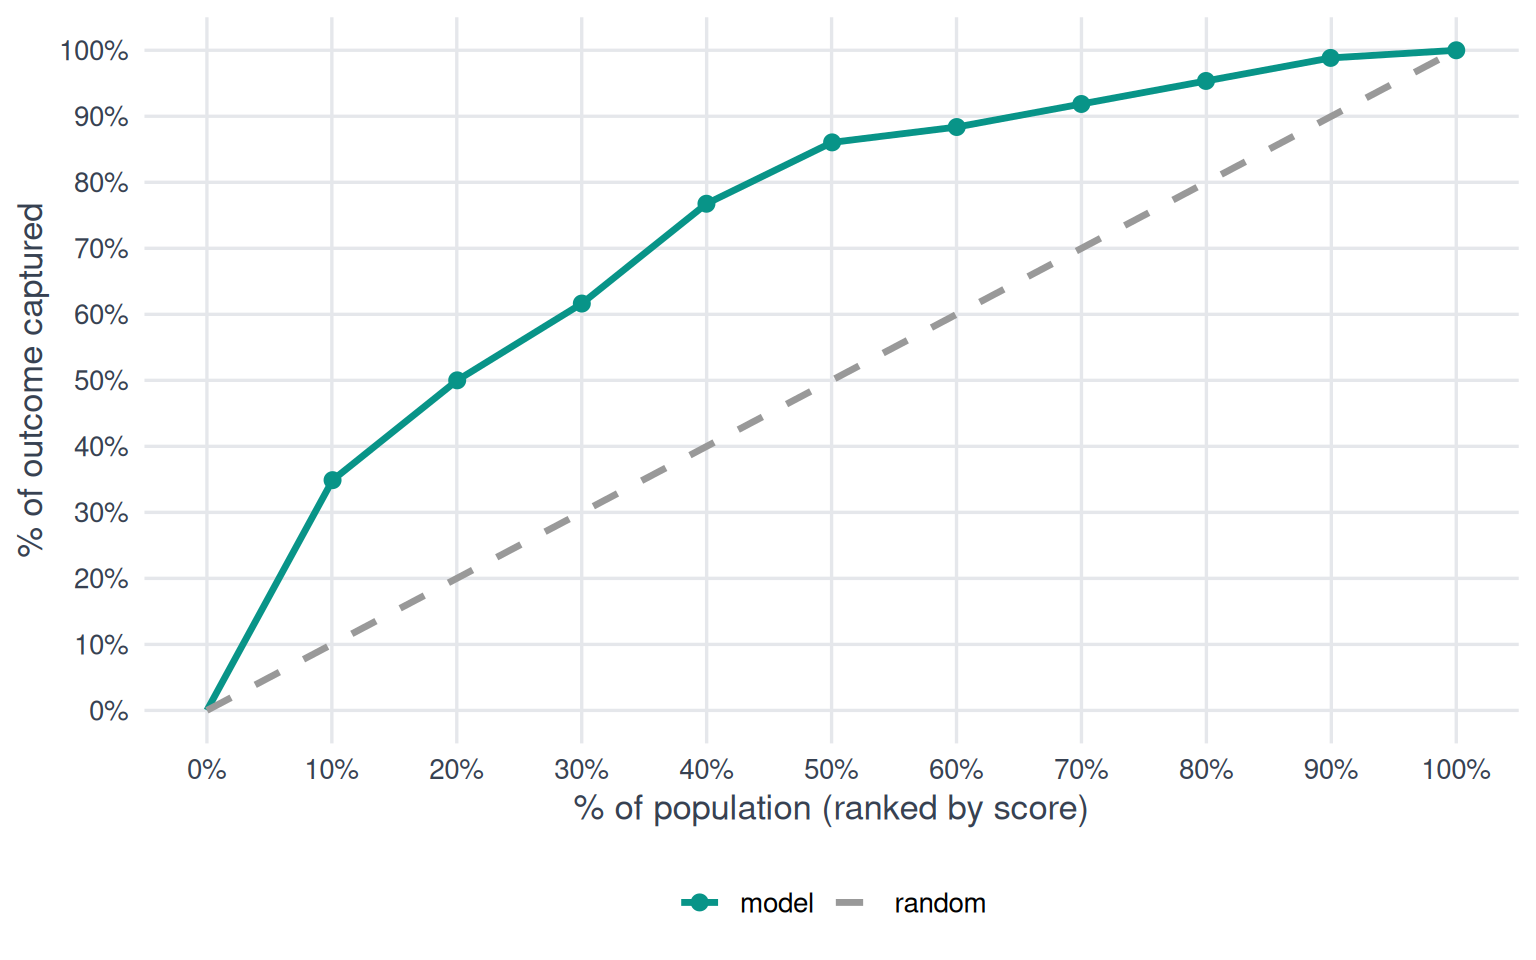
The further the model curve bows above the diagonal, the better the model concentrates the outcome in its top-ranked predictions.
Decile Analysis Table
| decile | count | mean actual | mean predicted | mae | lift |
|---|---|---|---|---|---|
| 10 | 123 | 0.24 | 0.21 | 0.03 | 3.47 |
| 9 | 122 | 0.11 | 0.13 | 0.03 | 1.52 |
| 8 | 122 | 0.08 | 0.10 | 0.02 | 1.17 |
| 7 | 122 | 0.11 | 0.08 | 0.03 | 1.52 |
| 6 | 123 | 0.06 | 0.06 | 0.004 | 0.92 |
| 5 | 122 | 0.02 | 0.05 | 0.03 | 0.23 |
| 4 | 122 | 0.02 | 0.03 | 0.009 | 0.35 |
| 3 | 122 | 0.02 | 0.02 | 0.002 | 0.35 |
| 2 | 122 | 0.02 | 0.01 | 0.01 | 0.35 |
| 1 | 123 | 0.008 | 0.008 | 1e-05 | 0.12 |
Architecture
This model is a deep neural network trained with TensorFlow.
Network structure
| layer | units | activation |
|---|---|---|
| ↓ dense | 128 | swish |
| ↓ batch normalization | ||
| ↓ dropout (0.30 rate) | ||
| ↓ dense | 76 | swish |
| ↓ batch normalization |
Hyperparameter configuration
- loss: binary_focal_crossentropy
- optimizer: rmsprop
- batch size: 64
- activation: sigmoid
- label smoothing: 0
- learning rate: 0.002
Features
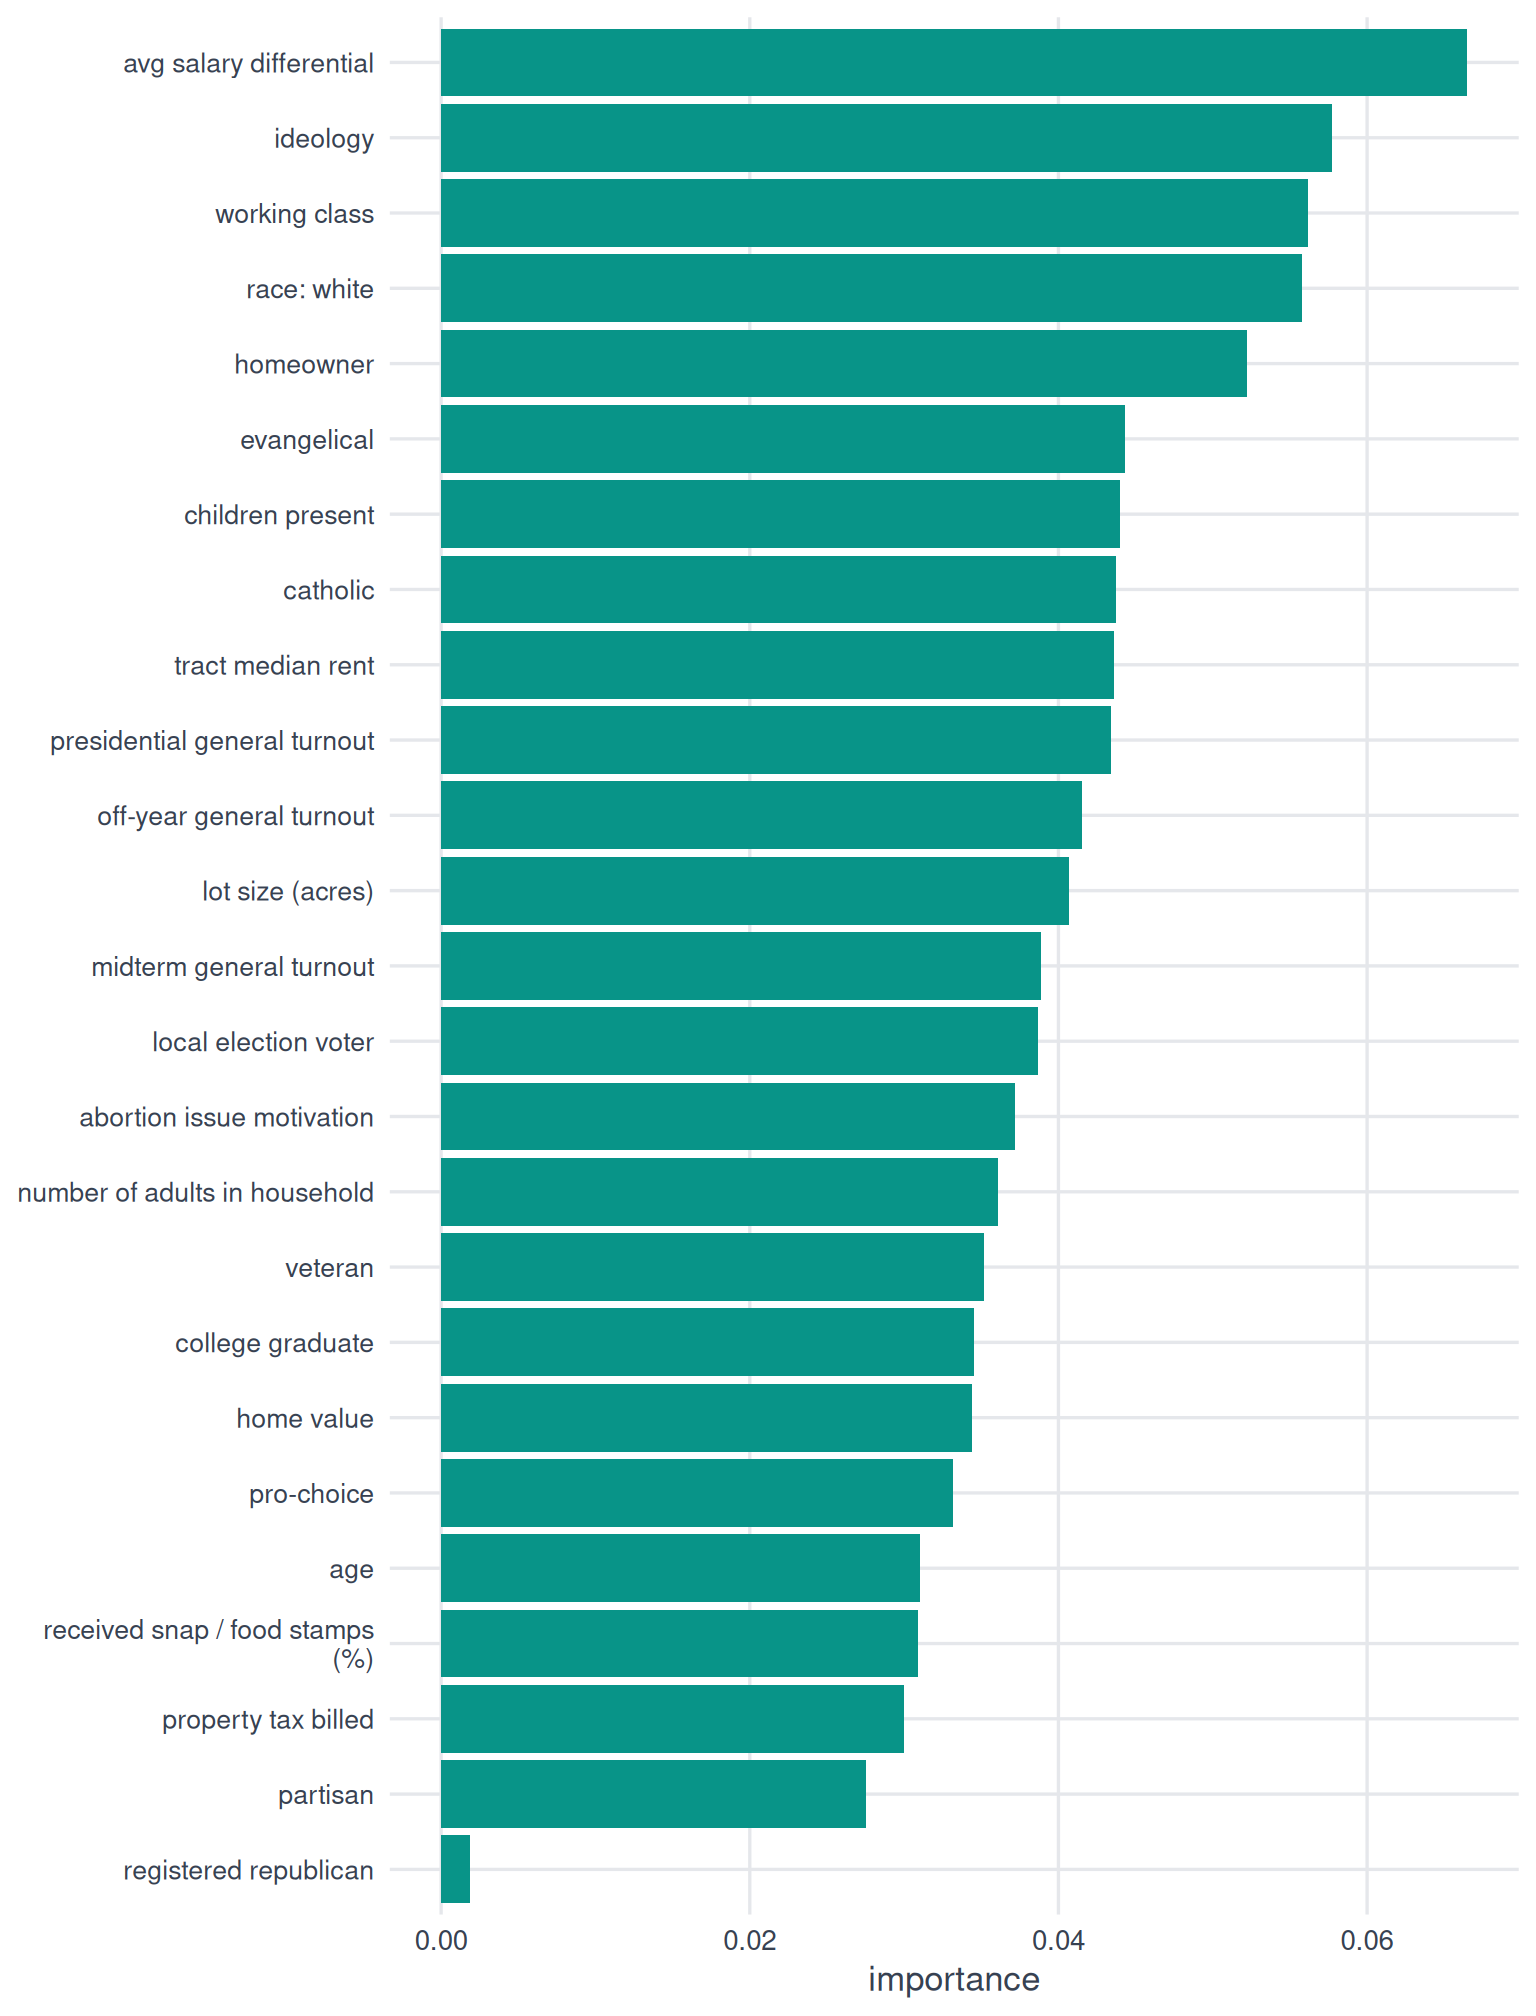
Importance
Sourcing
Agency for Healthcare Research and Quality
- received snap / food stamps (%)
Attom Property Data API
- lot size (acres)
- property tax billed
Revelio Labs
- avg salary differential
State voter files (via TargetSmart)
- age
- registered republican
TargetSmart
- abortion issue motivation score
- catholic score
- children present score
- college graduate score
- evangelical score
- homeowner score
- ideology score
- local election voter score
- midterm general turnout score
- off-year general turnout score
- partisan score
- presidential general turnout score
- pro-choice score
- race: white
- veteran score
- working class score
U.S. Census American Community Survey
- tract median rent
Verisk (via TargetSmart)
- home value
- number of adults in household
Implementation
Prediction distribution
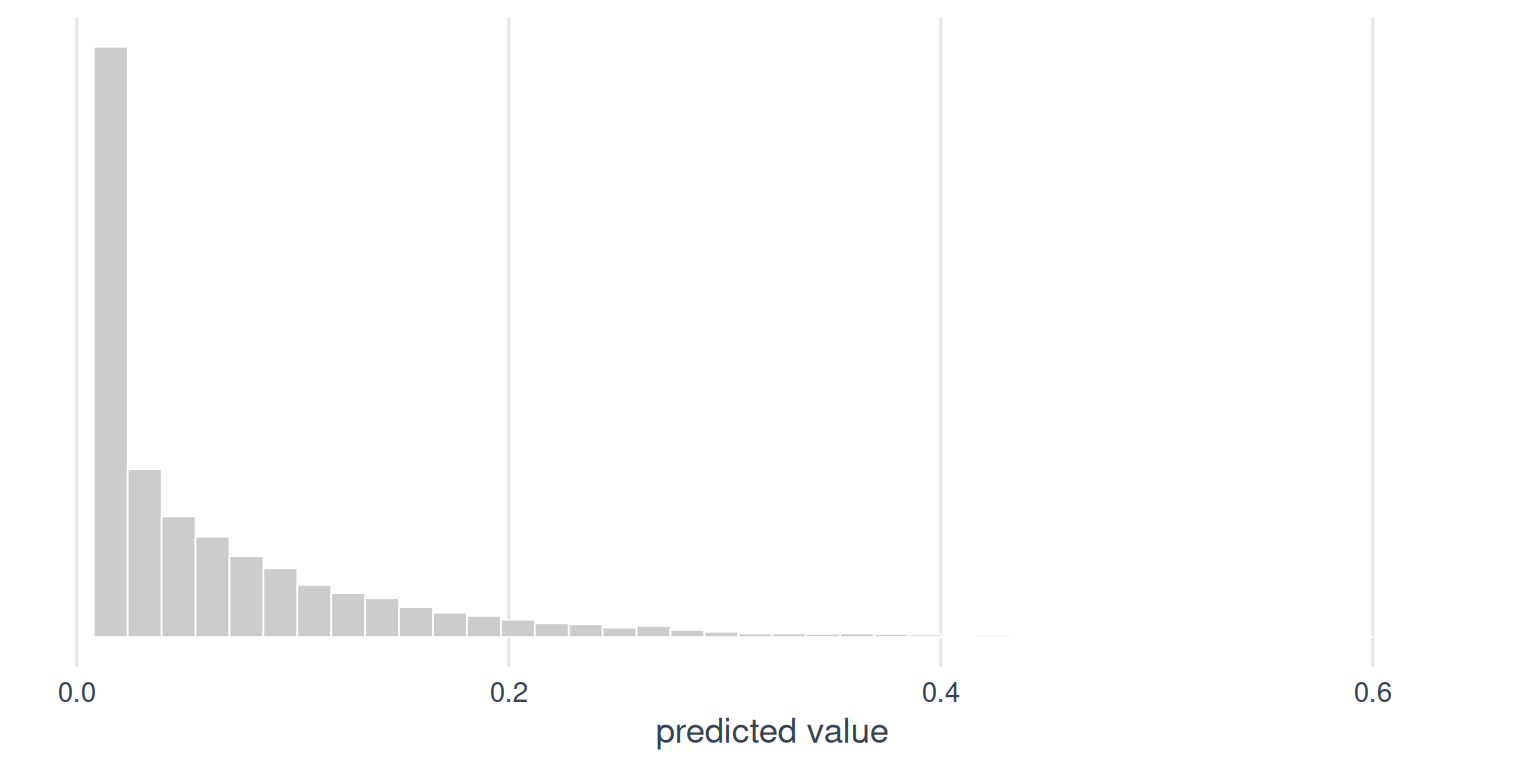
| statistic | value |
|---|---|
| mean | 0.07 |
| std dev | 0.08 |
| min | 0.01 |
| 25th | 0.02 |
| median | 0.03 |
| 75th | 0.08 |
| max | 0.77 |
Segments
| segment | lowest score | highest score | share of records |
|---|---|---|---|
| Most likely | 0.22 | 0.77 | 6.3% |
| Somewhat likely | 0.15 | 0.21 | 6.6% |
| Least likely | 0.01 | 0.14 | 87.1% |
External validity
Our model indicates that 7% of people with scored records receive SNAP benefits. USDA ERS SNAP Key Statistics reports 41.7M monthly SNAP recipients in FY2024. Children are roughly a third of recipients, so adult-level participation is closer to ~11% of U.S. adults.