| metric | value |
|---|---|
| R² (correlation) | 0.30 |
| root mean squared error | 863 |
| mean absolute error | 661 |
| huber loss | 660 |
| gini coefficient | — |
monthly housing cost
Overview
This model estimates a voter’s monthly housing payment as a continuous dollar value.
Built as a boosted tree regressor on survey data, it integrates property records, consumer residence indicators, voter-file features, and area-level rent and home-value context to produce monthly cost estimates.
Organizations can use these scores to support threshold segmentation and analysis of housing cost distributions across geographies.
- approach: dnn regressor
- training rows: 5,379
- last updated: 2026-09-06 18:24:02
Validation
Lift Chart
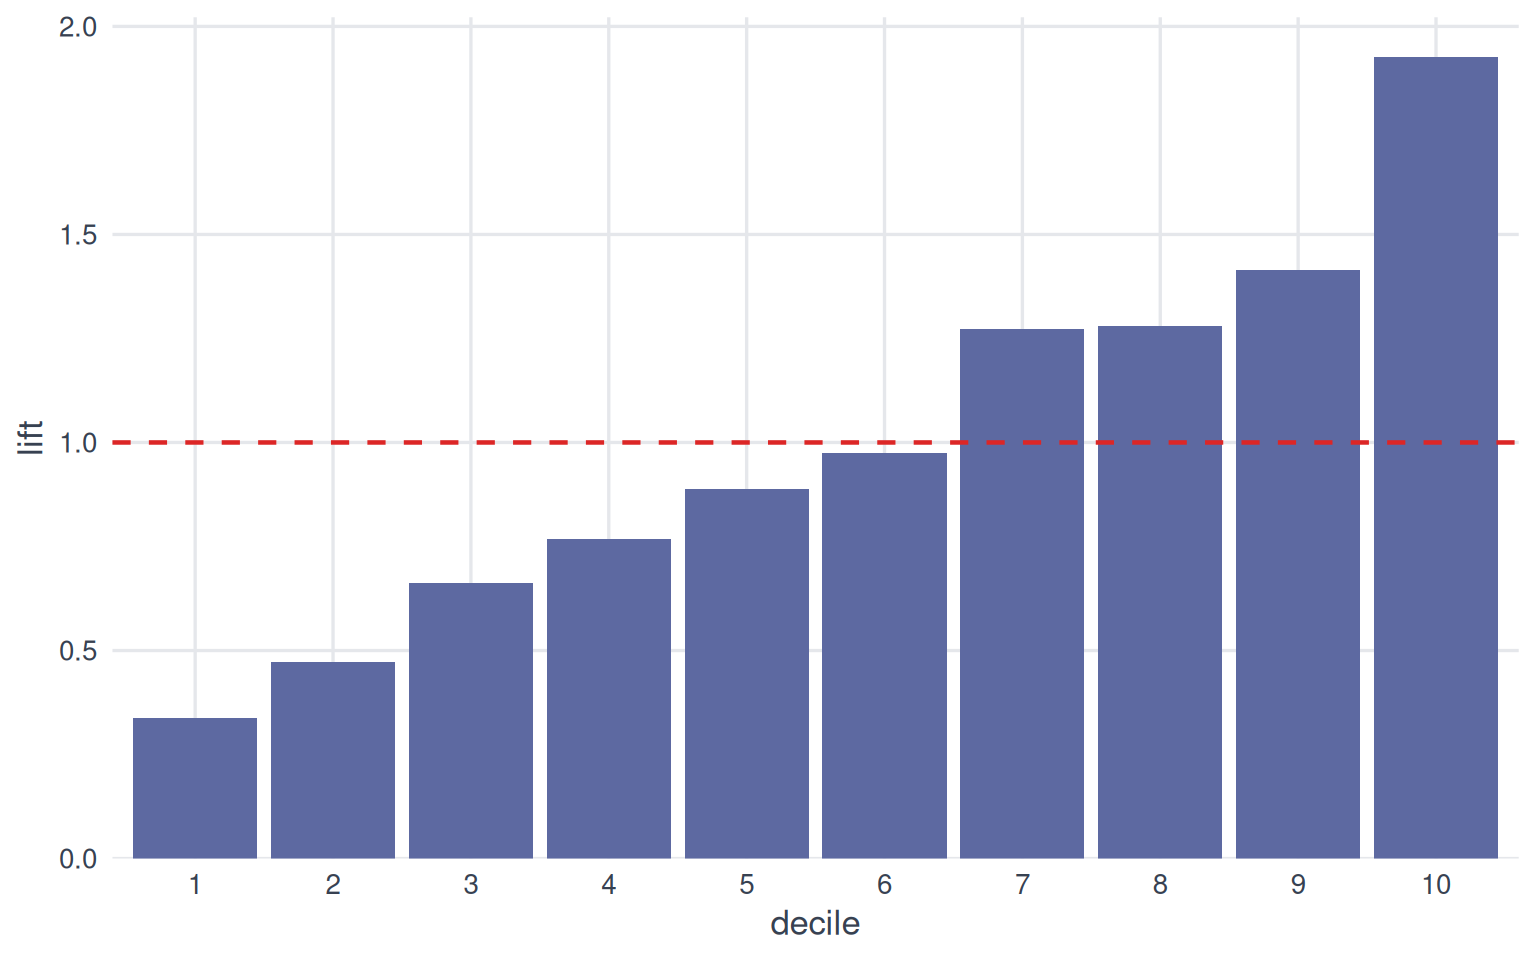
Each bar shows how much more common the outcome is within a score decile than in the population overall. Bars taller than the dashed line (lift of 1) mean the model’s top-ranked groups concentrate the outcome; a steady decline from decile 1 to 10 indicates the model is ranking effectively.
Calibration Plot
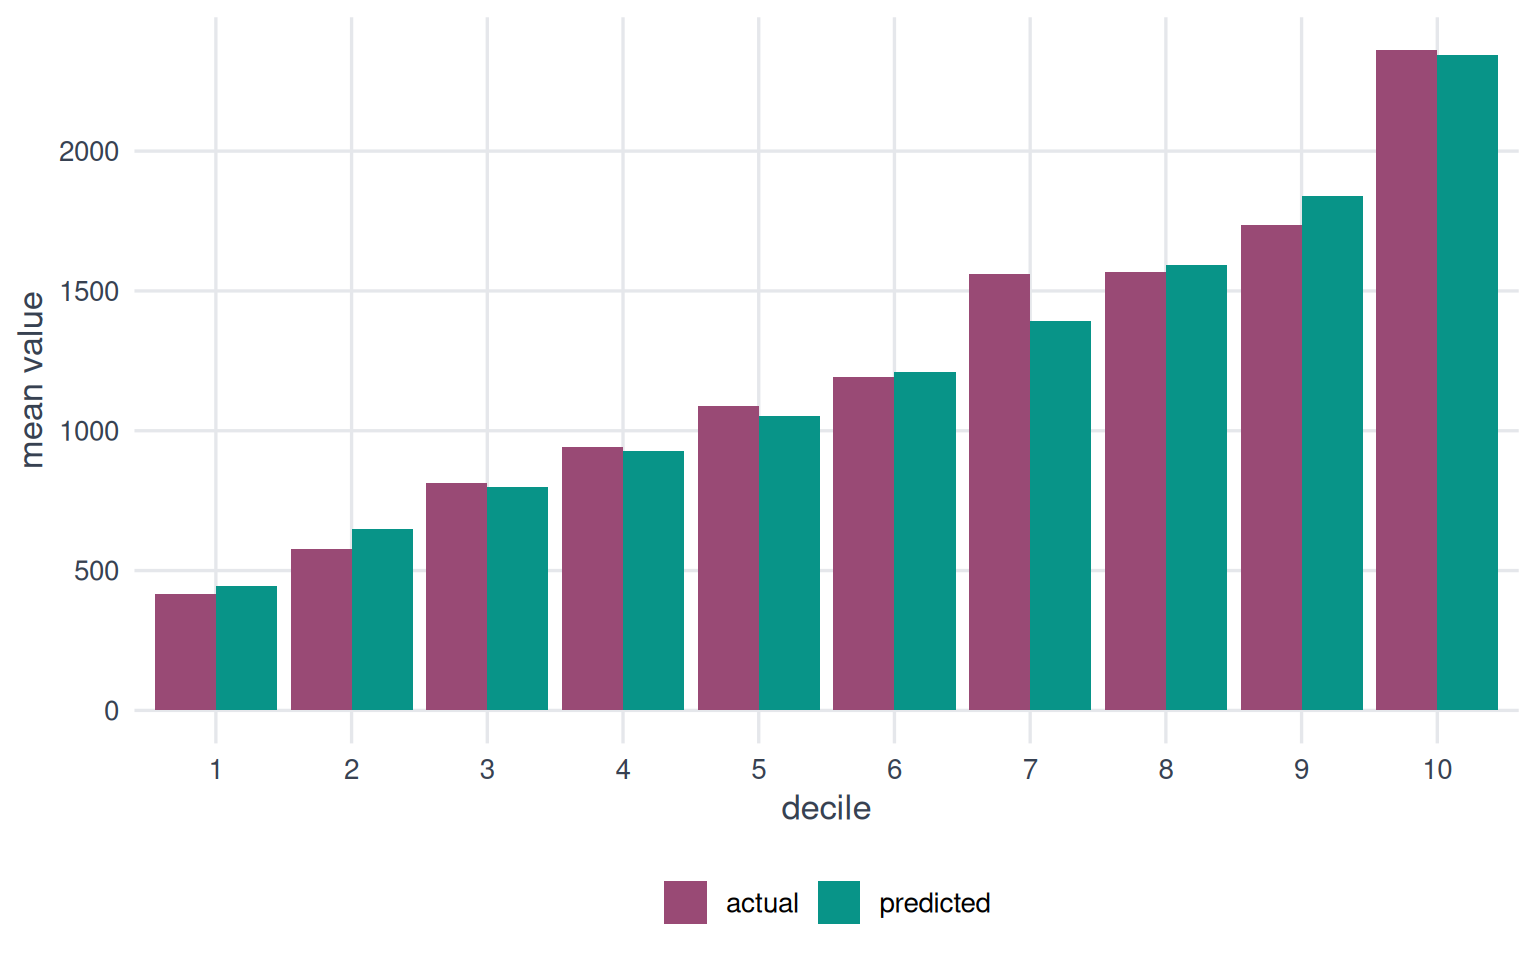
Bars of similar height within each decile indicate well-calibrated predictions. Systematic differences reveal where the model over- or under-predicts.
Cumulative Gains
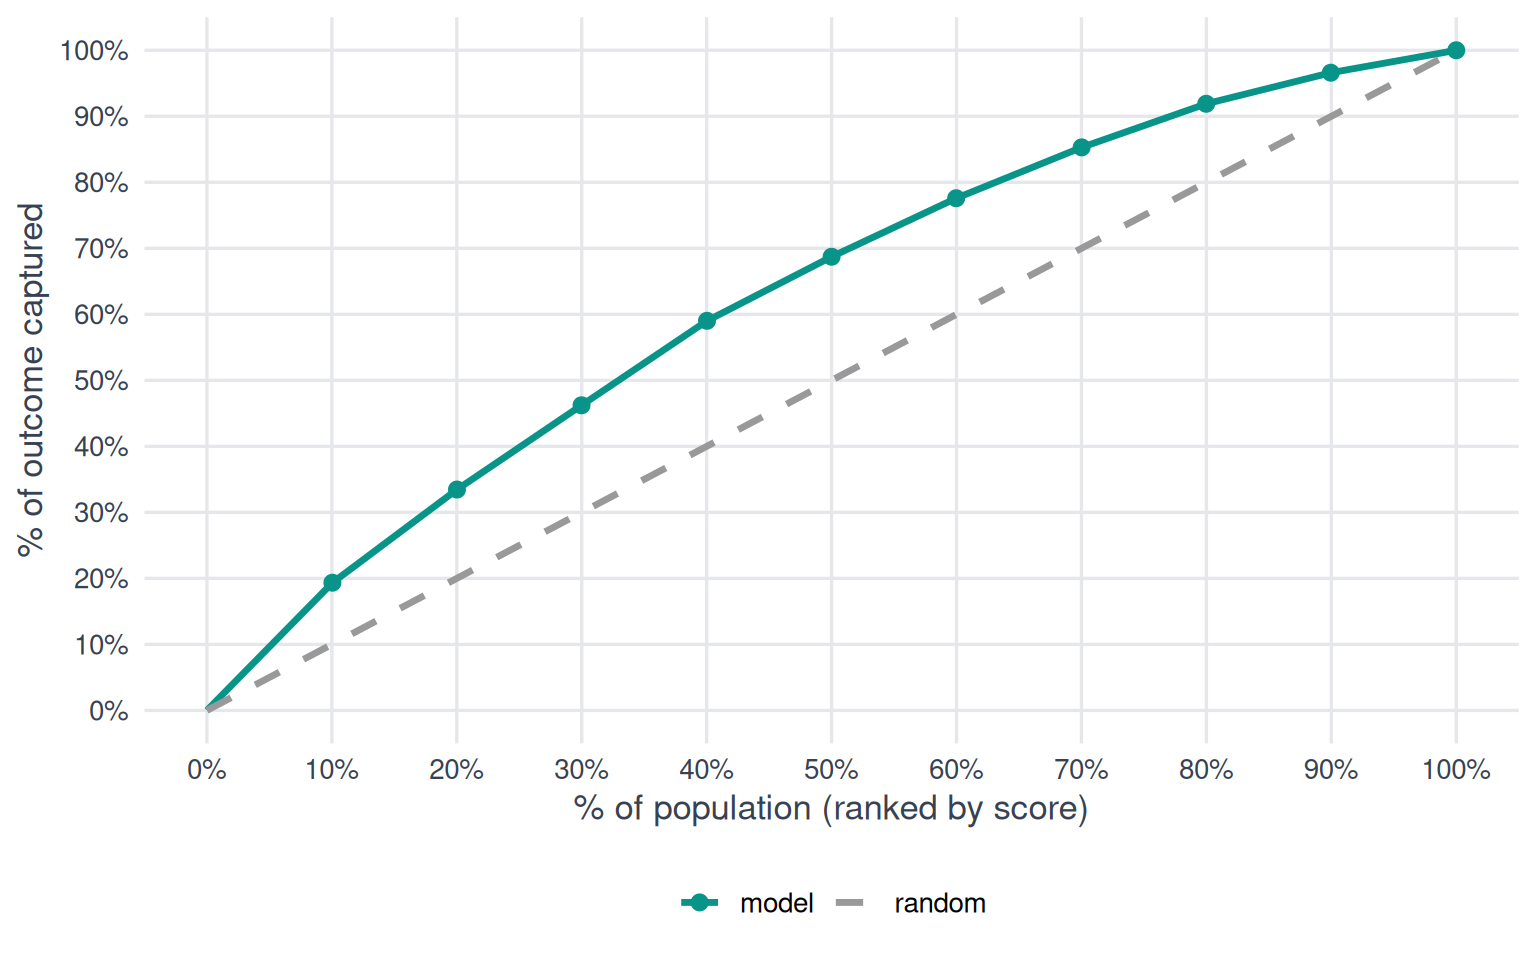
The further the model curve bows above the diagonal, the better the model concentrates the outcome in its top-ranked predictions.
Decile Analysis Table
| decile | count | mean actual | mean predicted | mae | lift |
|---|---|---|---|---|---|
| 10 | 138 | 2,361 | 2,345 | 16 | 1.93 |
| 9 | 137 | 1,735 | 1,840 | 105 | 1.42 |
| 8 | 137 | 1,569 | 1,594 | 24 | 1.28 |
| 7 | 138 | 1,562 | 1,392 | 169 | 1.27 |
| 6 | 137 | 1,193 | 1,210 | 17 | 0.97 |
| 5 | 137 | 1,089 | 1,051 | 38 | 0.89 |
| 4 | 138 | 940 | 928 | 12 | 0.77 |
| 3 | 137 | 812 | 799 | 13 | 0.66 |
| 2 | 137 | 578 | 650 | 72 | 0.47 |
| 1 | 138 | 415 | 446 | 31 | 0.34 |
Architecture
This model is a deep neural network regressor trained with BigQuery ML.
Hyperparameter configuration
- optimizer: adam
- max iterations: 20
- learn rate: 0.0029
- l1 regularization: 0
- l2 regularization: 0
- min relative progress: 0.01
- warm start: FALSE
- early stop: TRUE
- input label columns: affordability_monthly_housing_cost
- data split method: AUTO_SPLIT
- hidden units: 64, 32, 16
- batch size: 64
- dropout: 0
- num trials: 18
- max parallel trials: 5
- hparam tuning objectives: R_SQUARED
- enable global explain: FALSE
- tf version: 1.15
- activation fn: elu
Features
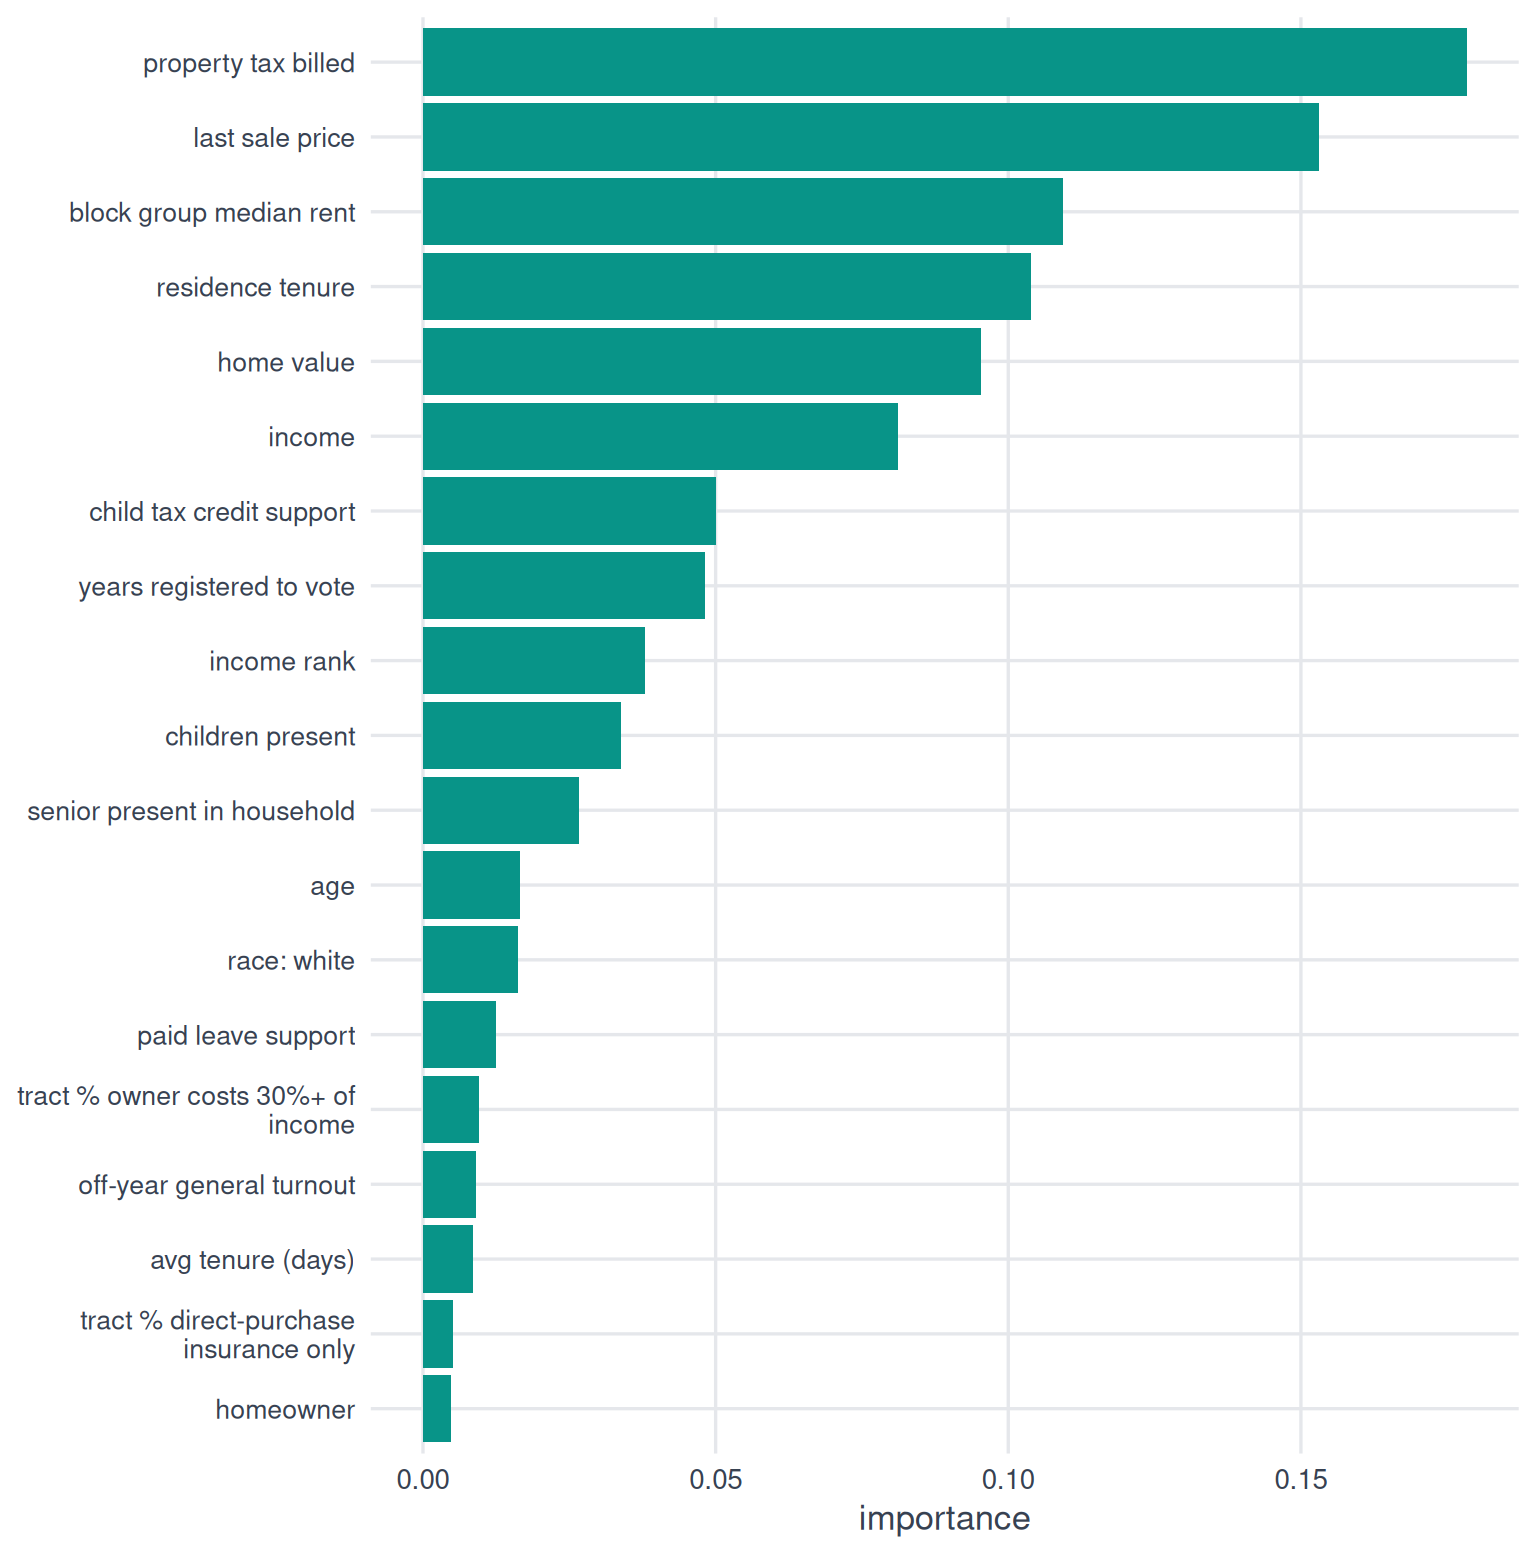
Importance
Sourcing
Agency for Healthcare Research and Quality
- tract % direct-purchase insurance only
- tract % owner costs 30%+ of income
Attom Property Data API
- last sale price
- property tax billed
Revelio Labs
- avg tenure (days)
State voter files (via TargetSmart)
- age
- years registered to vote
TargetSmart
- child tax credit support score
- children present score
- homeowner score
- income rank
- off-year general turnout score
- paid leave support score
- race: white
U.S. Census American Community Survey
- block group median rent
Verisk (via TargetSmart)
- home value
- income
- residence tenure
- senior present in household
Implementation
Prediction distribution
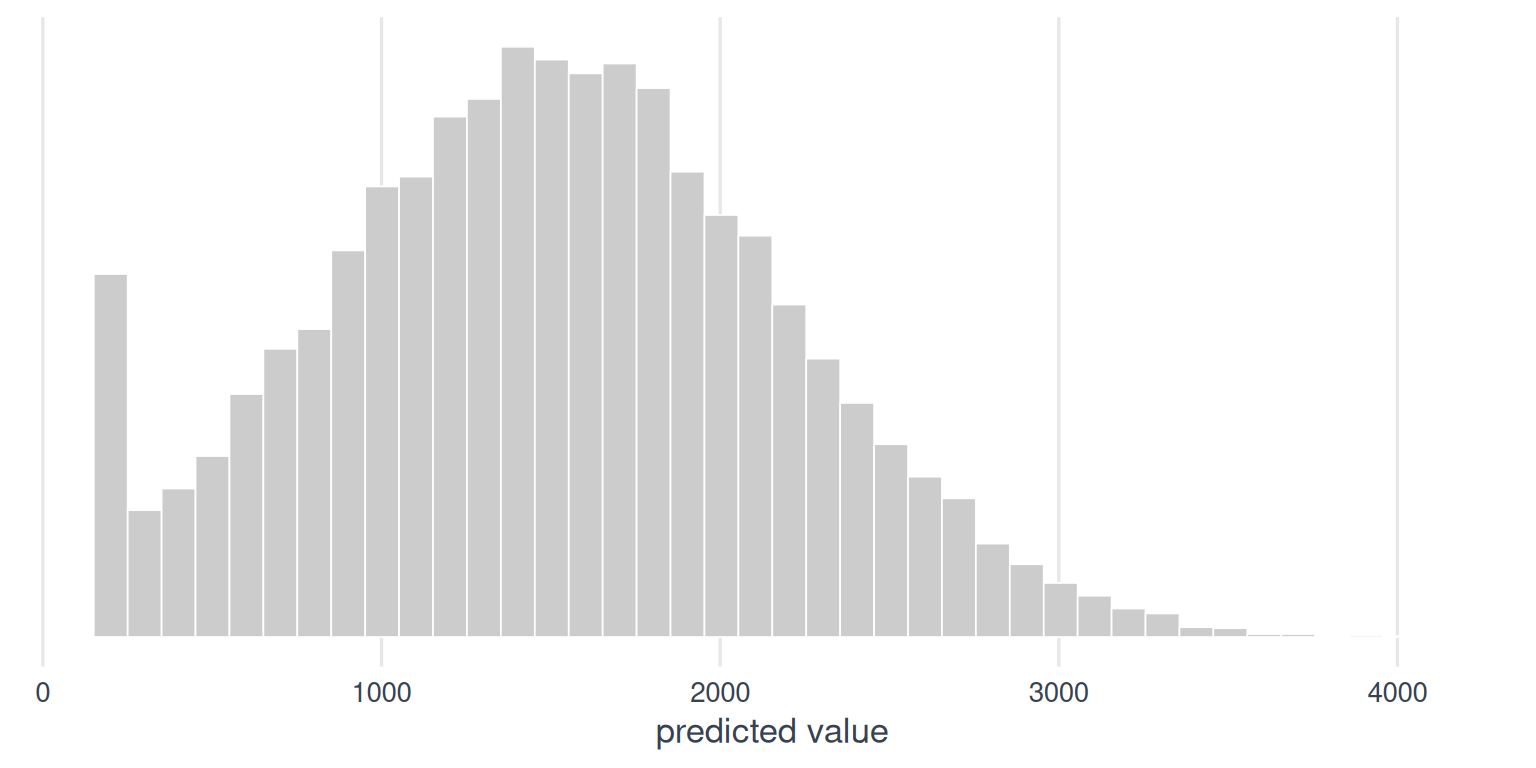
| statistic | value |
|---|---|
| mean | 1,500 |
| std dev | 682 |
| min | 156 |
| 25th | 967 |
| median | 1,399 |
| 75th | 1,926 |
| max | 7,828 |
External validity
Our model indicates an average monthly housing payment (rent or mortgage) of $1,500 across scored person records. 2024 U.S. Census ACS 1-year estimates (S2503) report a national median monthly gross rent of $1,435.