| metric | value |
|---|---|
| area under ROC curve | 0.88 |
| area under precision-recall curve | 0.47 |
| accuracy | 0.57 |
| precision | 0.16 |
| recall | 0.96 |
| f1 score | 0.27 |
| mean log loss | 0.80 |
| gini coefficient | 0.76 |
| brier skill score | 0.27 |
receives eitc
Overview
This model predicts whether a voter receives the Earned Income Tax Credit (EITC), a refundable tax credit for low- to moderate-income working individuals and families.
Trained on survey data, it incorporates employment duration, education, and neighborhood income patterns to identify likely recipients.
Organizations can use these scores for outreach around tax filing assistance, benefit awareness, and economic mobility programs.
- approach: deep learning
- training rows: 4,992
- last updated: 2026-08-13 19:23:29
Validation
Lift Chart
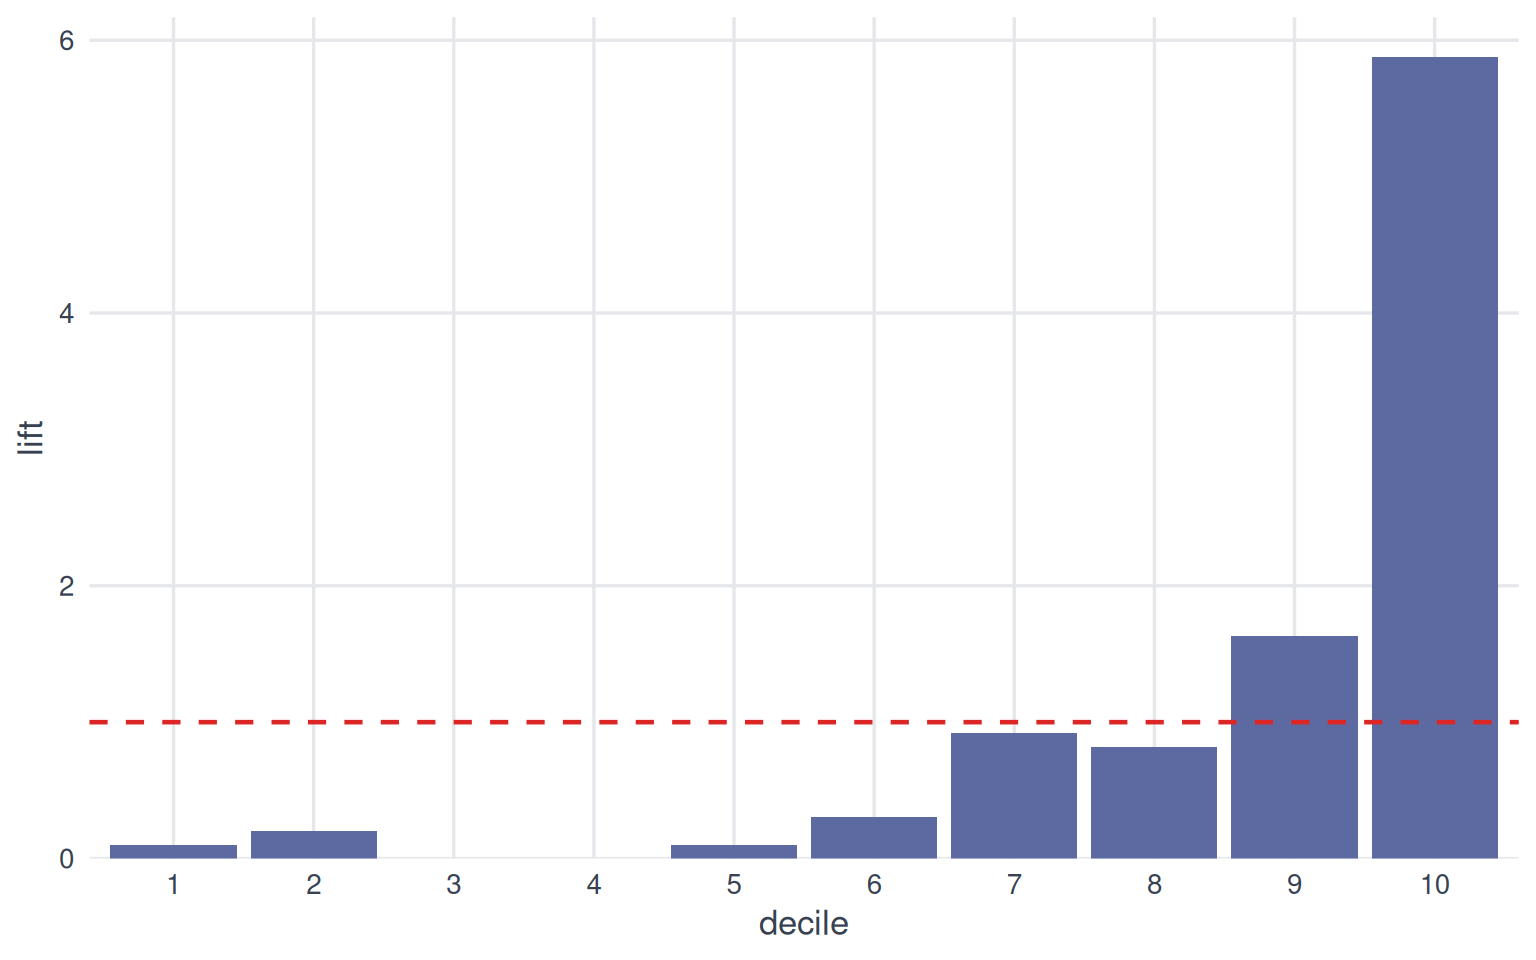
Each bar shows how much more common the outcome is within a score decile than in the population overall. Bars taller than the dashed line (lift of 1) mean the model’s top-ranked groups concentrate the outcome; a steady decline from decile 1 to 10 indicates the model is ranking effectively.
Calibration Plot
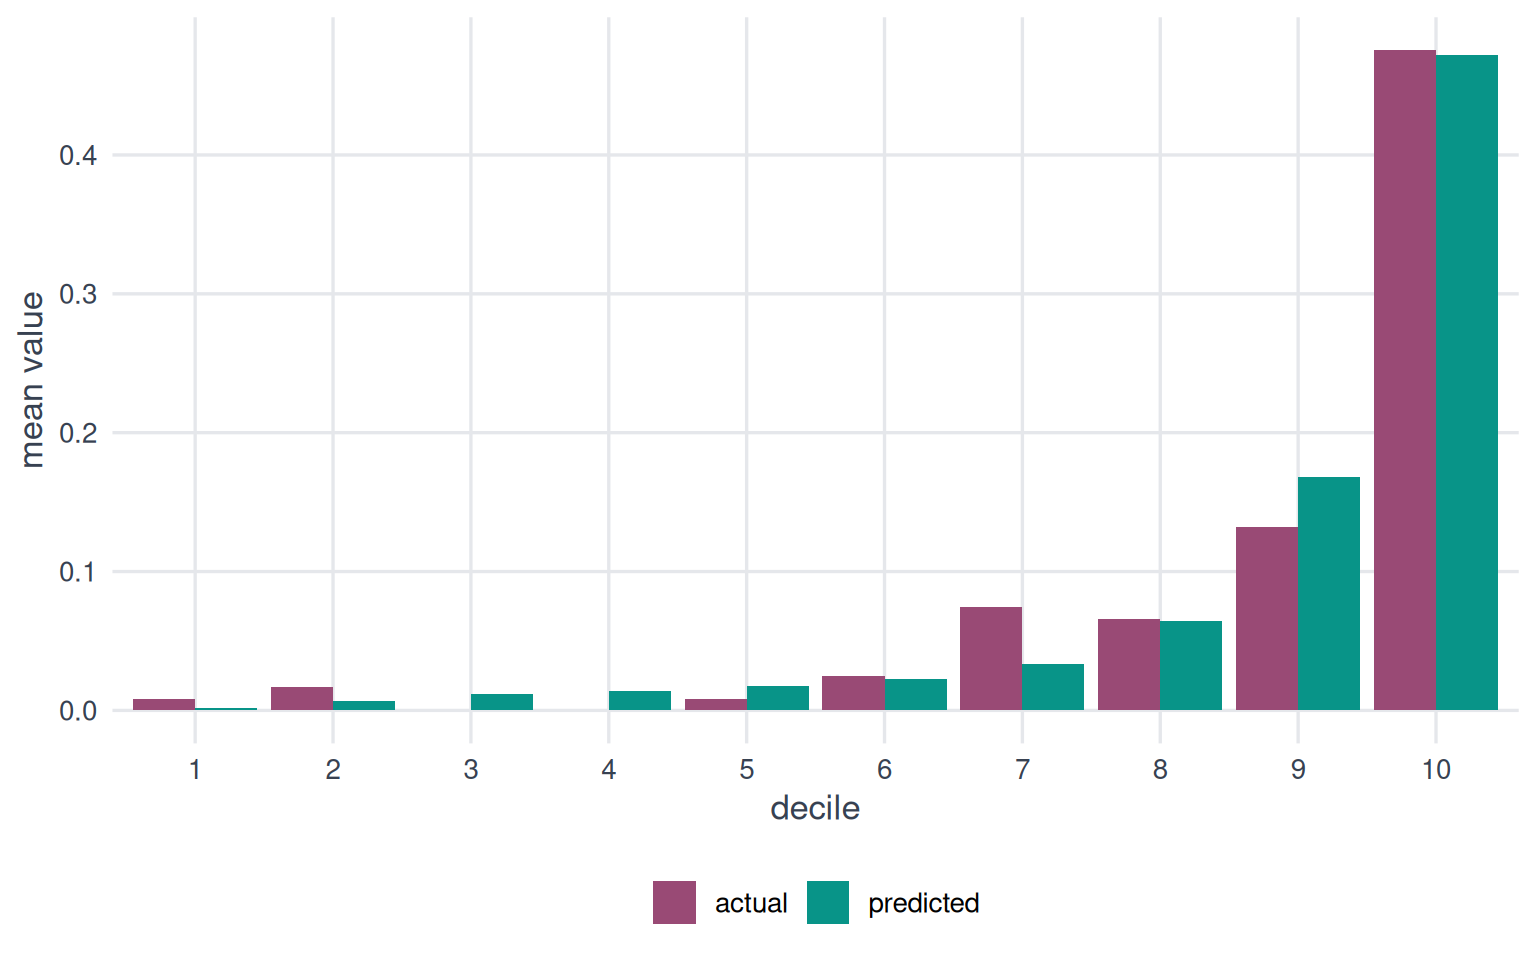
Bars of similar height within each decile indicate well-calibrated predictions. Systematic differences reveal where the model over- or under-predicts.
Cumulative Gains
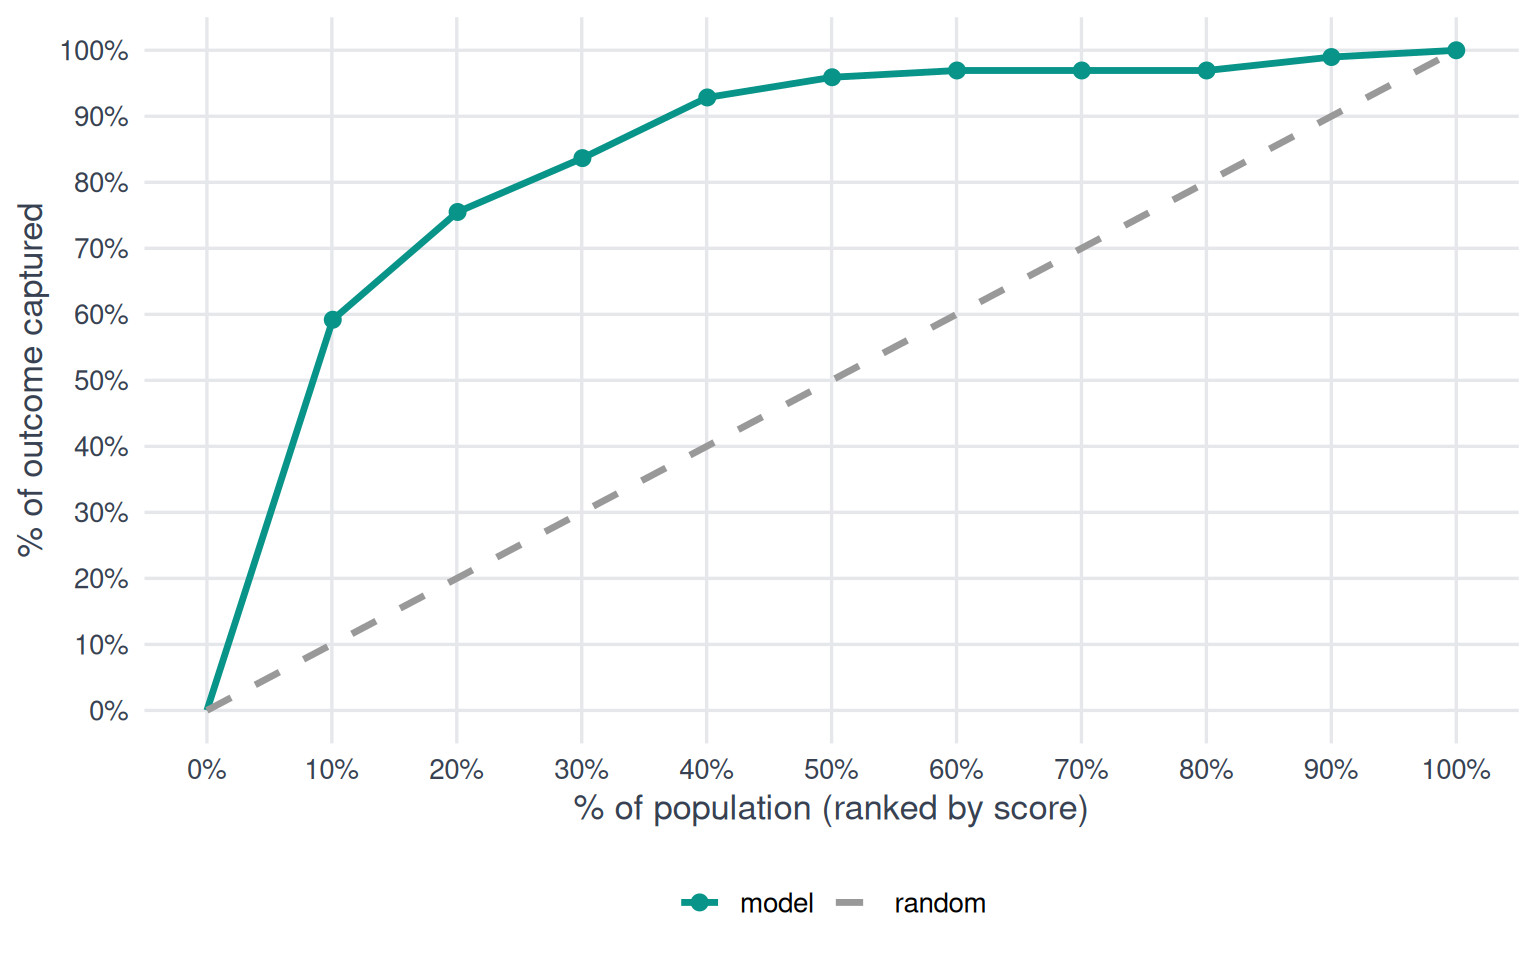
The further the model curve bows above the diagonal, the better the model concentrates the outcome in its top-ranked predictions.
Decile Analysis Table
| decile | count | mean actual | mean predicted | mae | lift |
|---|---|---|---|---|---|
| 10 | 122 | 0.48 | 0.47 | 0.003 | 5.87 |
| 9 | 121 | 0.13 | 0.17 | 0.04 | 1.63 |
| 8 | 121 | 0.07 | 0.06 | 0.001 | 0.82 |
| 7 | 121 | 0.07 | 0.03 | 0.04 | 0.92 |
| 6 | 121 | 0.02 | 0.02 | 0.002 | 0.31 |
| 5 | 121 | 0.008 | 0.02 | 0.009 | 0.10 |
| 4 | 121 | 0 | 0.01 | 0.01 | 0.00 |
| 3 | 121 | 0 | 0.01 | 0.01 | 0.00 |
| 2 | 121 | 0.02 | 0.007 | 0.01 | 0.20 |
| 1 | 121 | 0.008 | 0.002 | 0.006 | 0.10 |
Architecture
This model is a deep neural network trained with TensorFlow.
Network structure
| layer | units | activation |
|---|---|---|
| ↓ dense | 128 | |
| ↓ dropout (0.40 rate) | ||
| ↓ dense | 91 | |
| ↓ dropout (0.40 rate) | ||
| ↓ dense | 54 |
Hyperparameter configuration
- loss: binary_focal_crossentropy
- optimizer: adamax
- batch size: 64
- activation: hard_sigmoid
- label smoothing: 0
- learning rate: 5e-04
Features
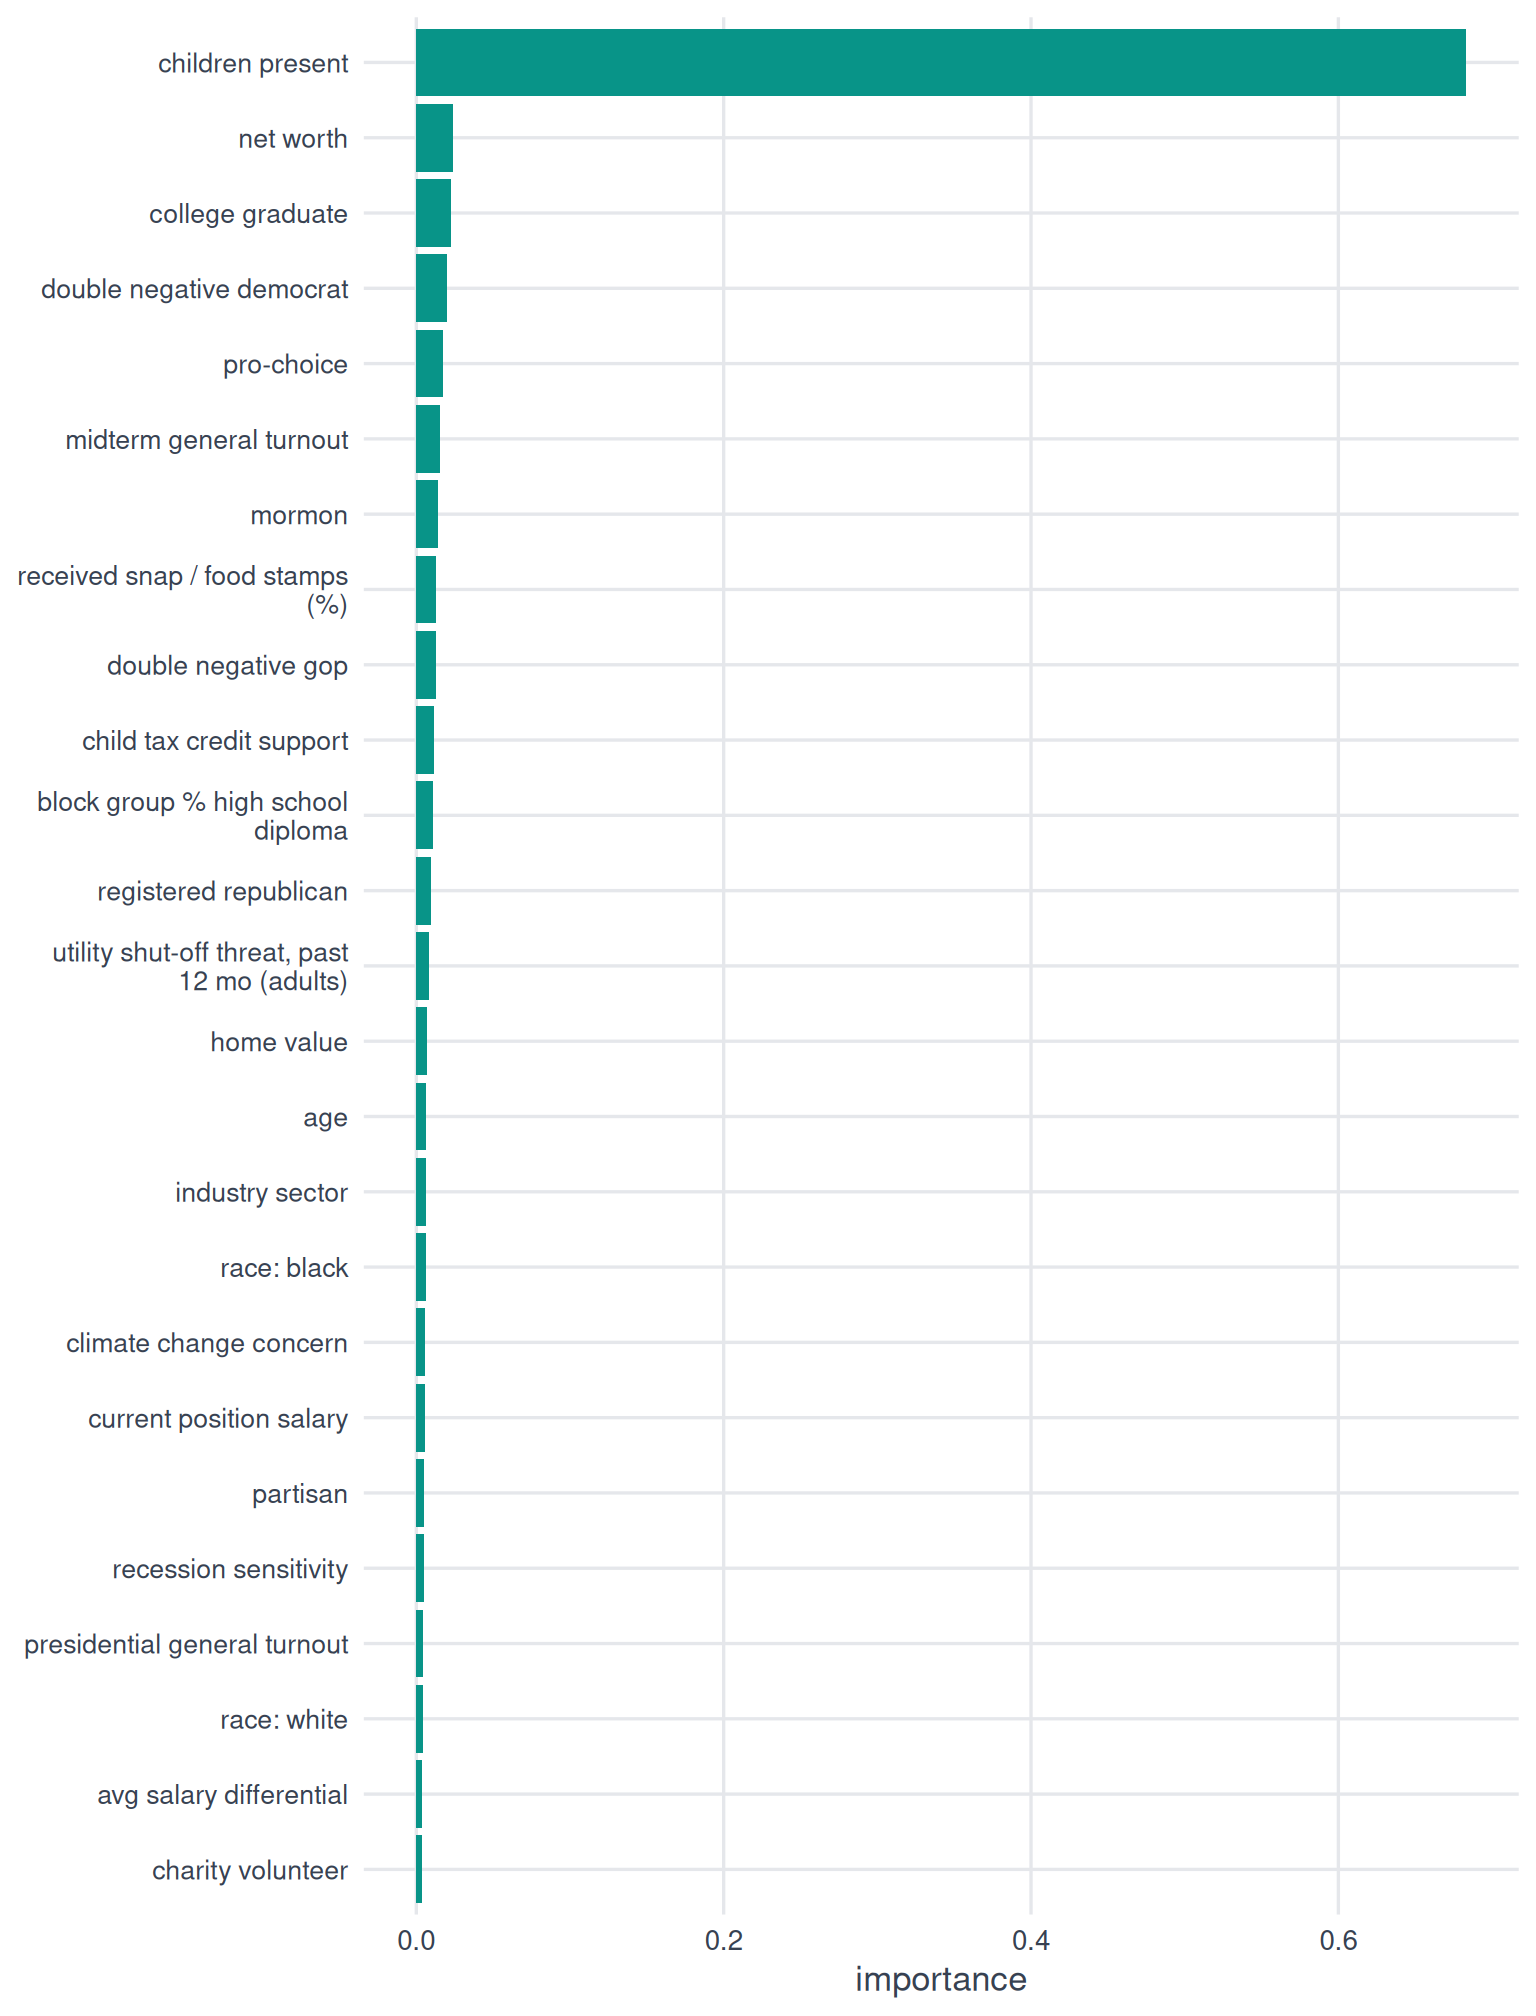
Importance
Sourcing
Agency for Healthcare Research and Quality
- received snap / food stamps (%)
CDC WONDER
- utility shut-off threat, past 12 mo (adults)
Revelio Labs
- avg salary differential
- current position salary
- industry sector
State voter files (via TargetSmart)
- age
- registered republican
TargetSmart
- child tax credit support score
- children present score
- climate change concern score
- college graduate score
- double negative democrat score
- double negative gop score
- midterm general turnout score
- mormon score
- partisan score
- presidential general turnout score
- pro-choice score
- race: black
- race: white
- recession sensitivity score
U.S. Census American Community Survey
- block group % high school diploma
Verisk (via TargetSmart)
- charity volunteer
- home value
- net worth
Implementation
Prediction distribution
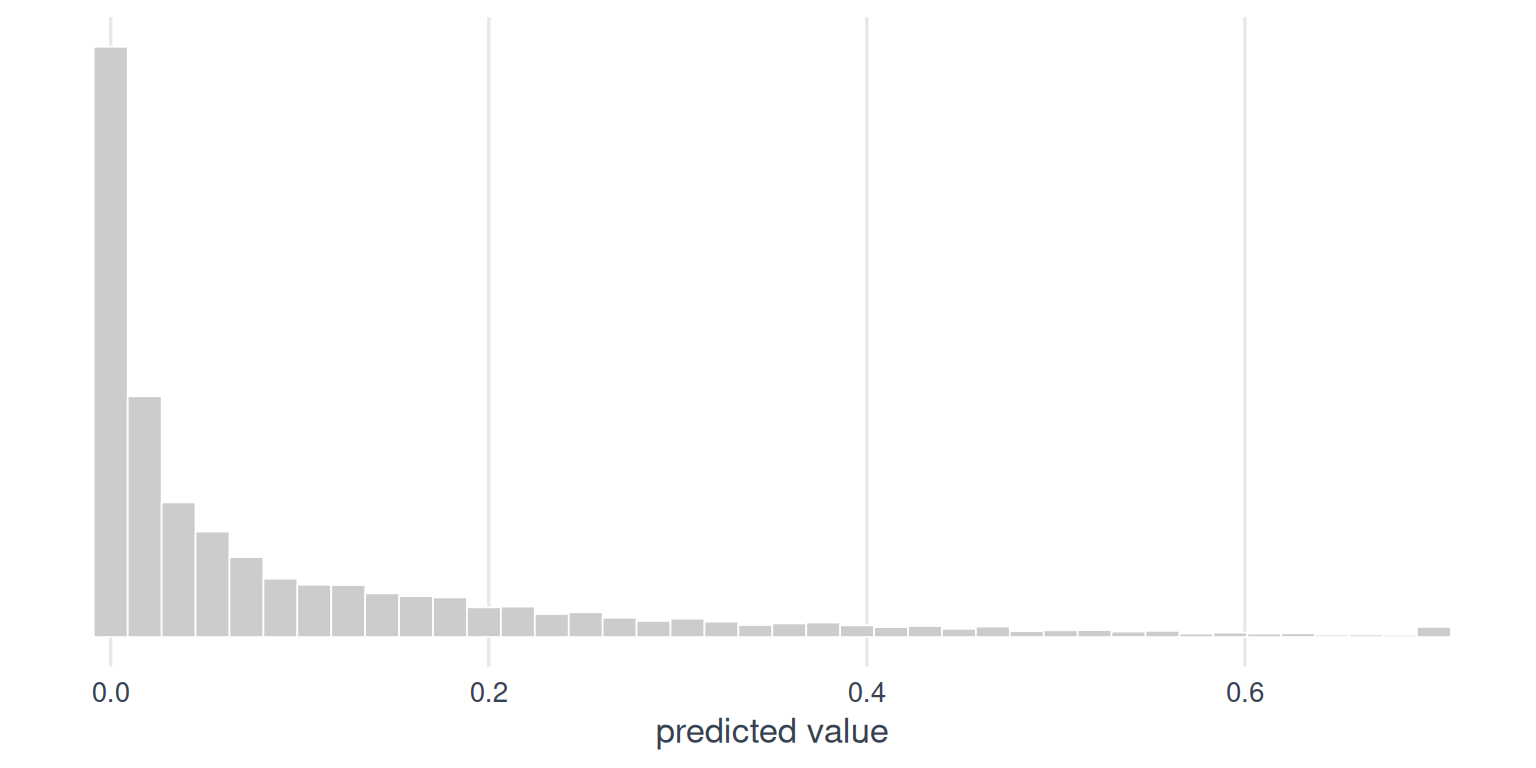
| statistic | value |
|---|---|
| mean | 0.10 |
| std dev | 0.15 |
| min | 0 |
| 25th | 0.01 |
| median | 0.03 |
| 75th | 0.12 |
| max | 0.70 |
Segments
| segment | lowest score | highest score | share of records |
|---|---|---|---|
| Most likely | 0.33 | 0.70 | 10.2% |
| Somewhat likely | 0.18 | 0.32 | 9.4% |
| Least likely | 0 | 0.17 | 80.4% |
External validity
Our model indicates that 10% of people with scored records claim the Earned Income Tax Credit. Per the IRS EITC Statistics for Tax Year 2023, ~24M working families and individuals received the EITC. Applying the IRS filing-status breakdown (~19% married filing jointly), this works out to roughly 28–29M adults benefiting — about 11% of all U.S. adults.