| metric | value |
|---|---|
| area under ROC curve | 0.90 |
| area under precision-recall curve | 0.77 |
| accuracy | 0.86 |
| precision | 0.79 |
| recall | 0.72 |
| f1 score | 0.76 |
| mean log loss | 0.35 |
| gini coefficient | 0.80 |
| brier skill score | 0.48 |
enrolled in medicare
Overview
This model predicts Medicare enrollment — the federal health insurance program primarily serving adults 65 and older.
Trained on survey data, it achieves strong performance by leveraging age, household composition, and economic indicators.
Organizations can use these scores to target outreach around Medicare benefits, prescription drug coverage, and health care policy affecting seniors.
- approach: dnn classifier
- training rows: 5,472
- last updated: 2026-09-14 01:36:17
Validation
Lift Chart
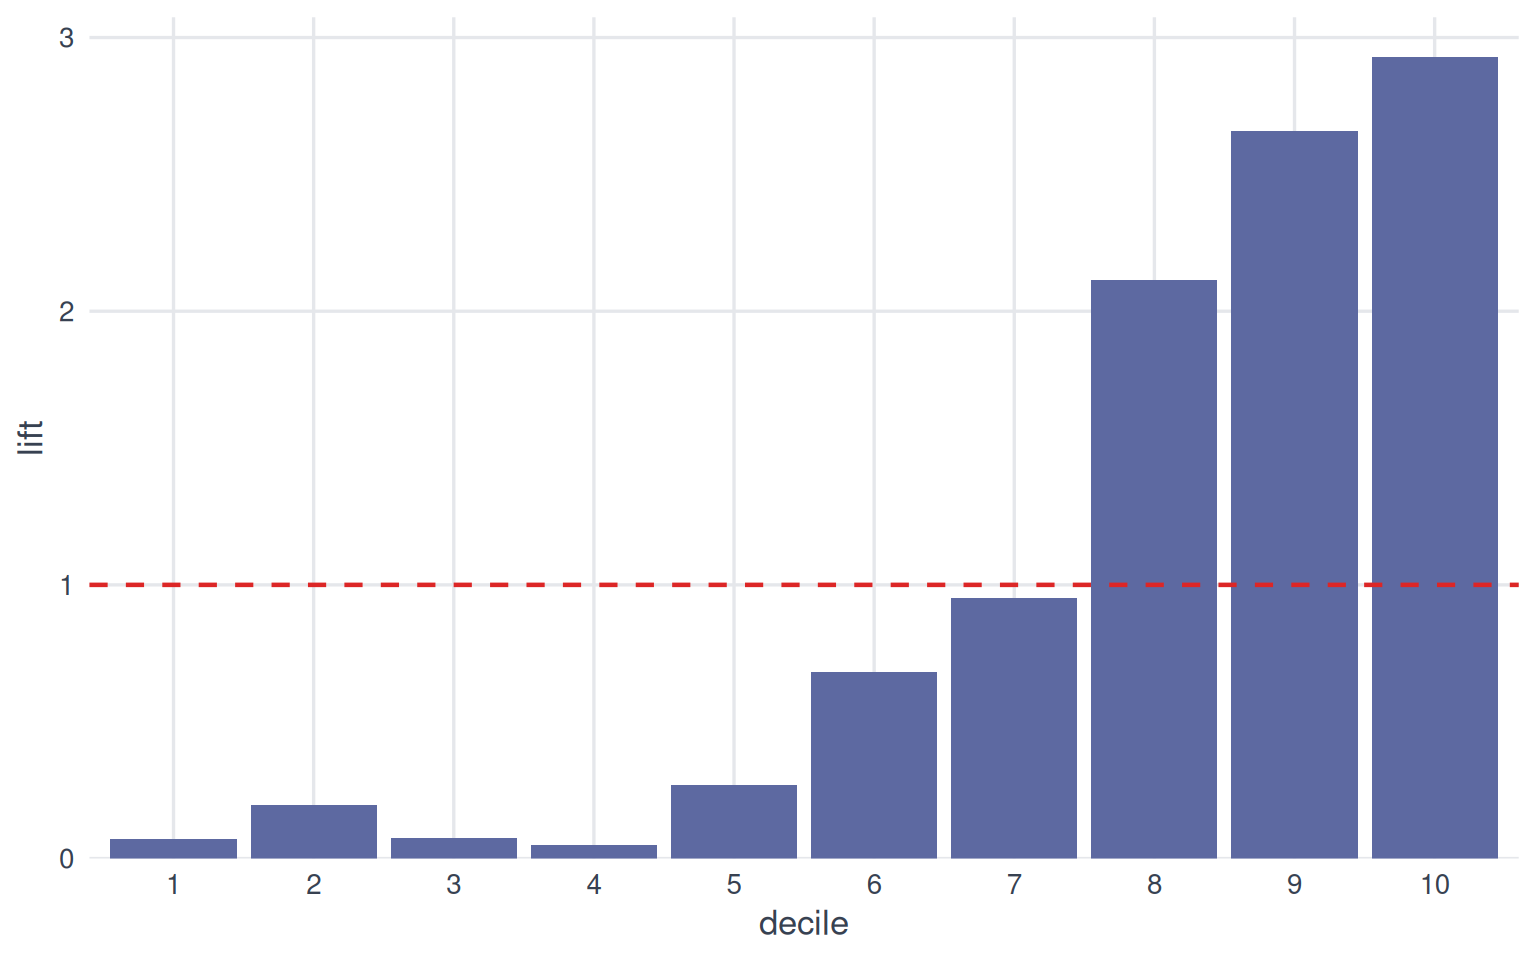
Each bar shows how much more common the outcome is within a score decile than in the population overall. Bars taller than the dashed line (lift of 1) mean the model’s top-ranked groups concentrate the outcome; a steady decline from decile 1 to 10 indicates the model is ranking effectively.
Calibration Plot
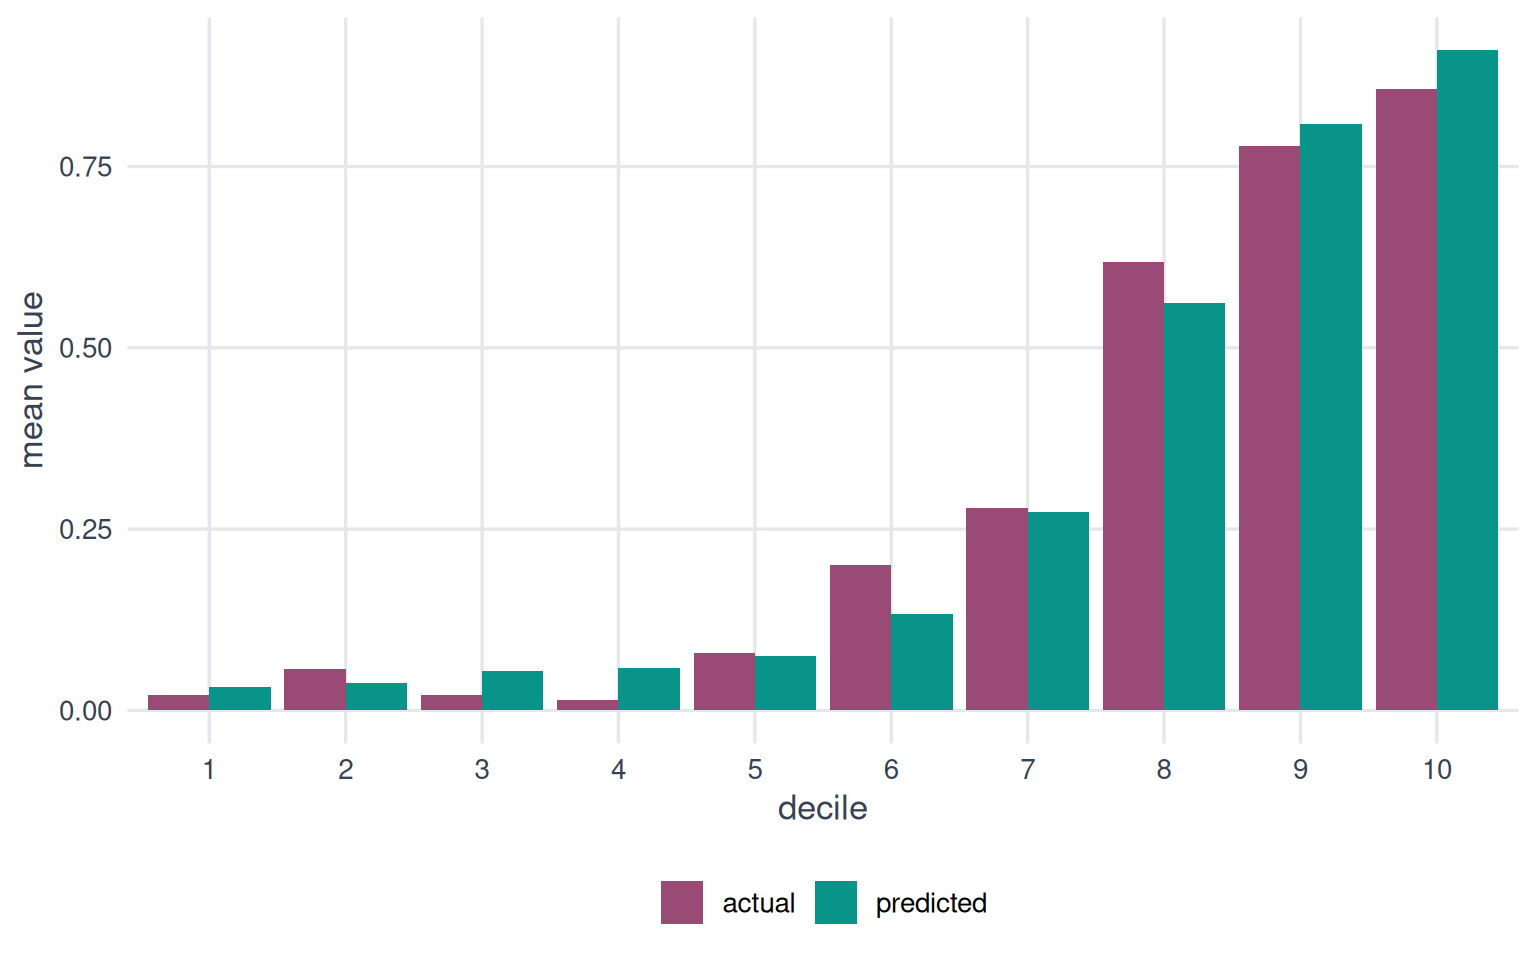
Bars of similar height within each decile indicate well-calibrated predictions. Systematic differences reveal where the model over- or under-predicts.
Cumulative Gains
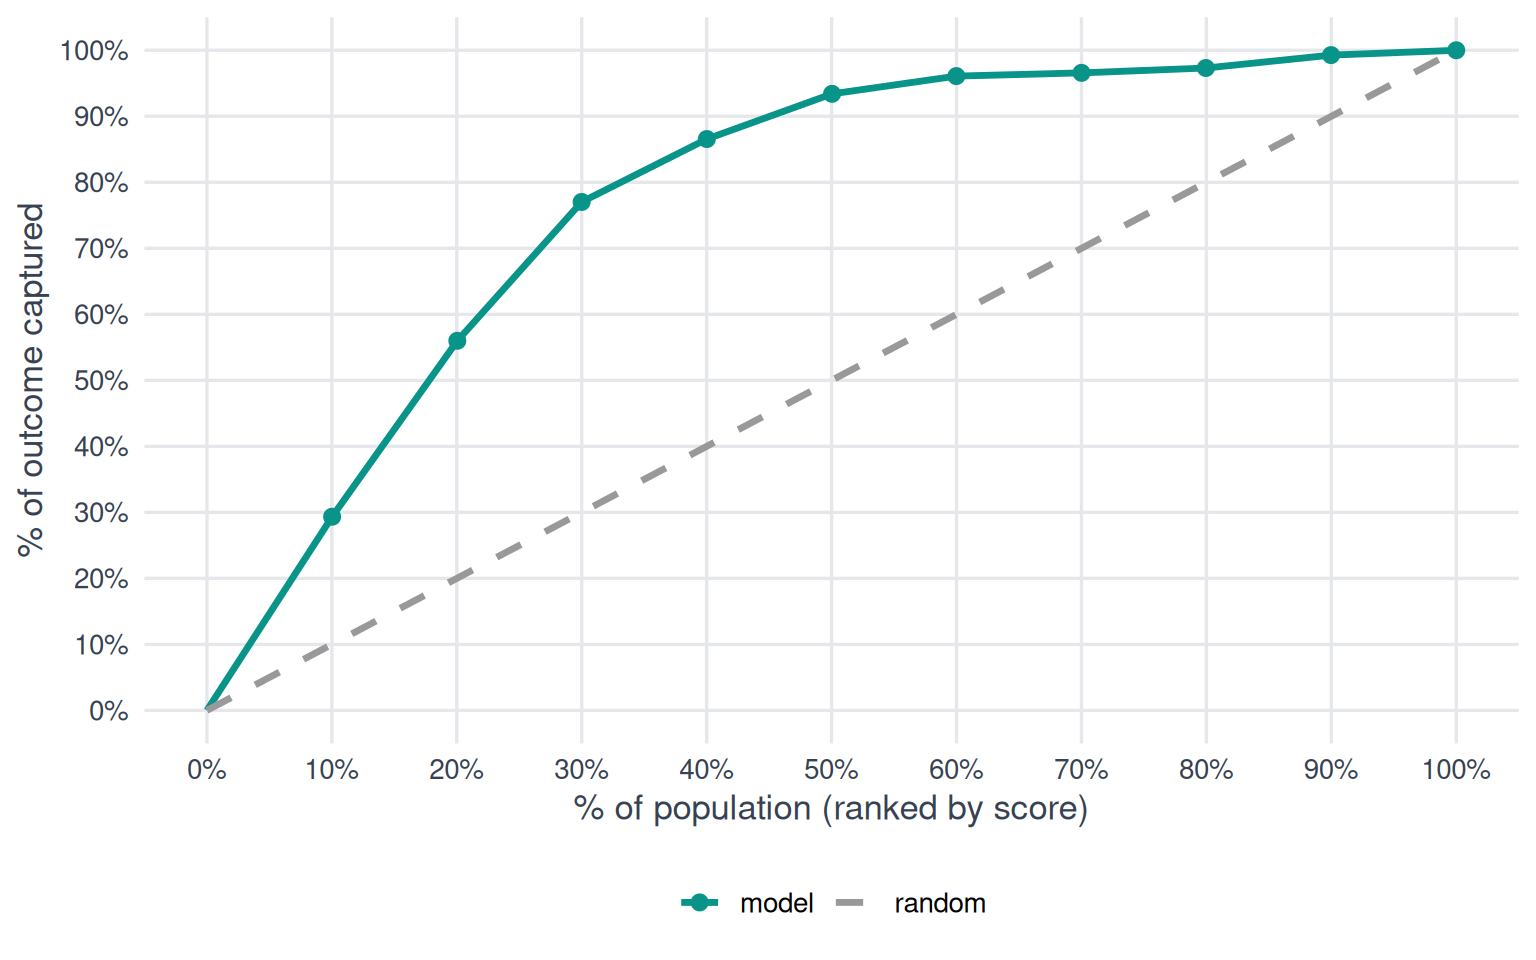
The further the model curve bows above the diagonal, the better the model concentrates the outcome in its top-ranked predictions.
Decile Analysis Table
| decile | count | mean actual | mean predicted | mae | lift |
|---|---|---|---|---|---|
| 10 | 140 | 0.86 | 0.91 | 0.05 | 2.93 |
| 9 | 140 | 0.78 | 0.81 | 0.03 | 2.66 |
| 8 | 139 | 0.62 | 0.56 | 0.06 | 2.11 |
| 7 | 140 | 0.28 | 0.27 | 0.005 | 0.95 |
| 6 | 140 | 0.20 | 0.13 | 0.07 | 0.68 |
| 5 | 139 | 0.08 | 0.07 | 0.004 | 0.27 |
| 4 | 140 | 0.01 | 0.06 | 0.04 | 0.05 |
| 3 | 139 | 0.02 | 0.05 | 0.03 | 0.07 |
| 2 | 140 | 0.06 | 0.04 | 0.02 | 0.20 |
| 1 | 140 | 0.02 | 0.03 | 0.01 | 0.07 |
Architecture
This model is a deep neural network classifier trained with BigQuery ML.
Hyperparameter configuration
- optimizer: adagrad
- max iterations: 20
- learn rate: 0.0017
- l1 regularization: 0
- l2 regularization: 0
- min relative progress: 0.01
- warm start: FALSE
- early stop: TRUE
- input label columns: benefits_enrolled_in_medicare
- data split method: AUTO_SPLIT
- hidden units: 64, 32, 16
- batch size: 64
- dropout: 0.1004
- num trials: 18
- max parallel trials: 5
- hparam tuning objectives: ROC_AUC
- enable global explain: FALSE
- tf version: 1.15
- activation fn: elu
- auto class weights: FALSE
Features
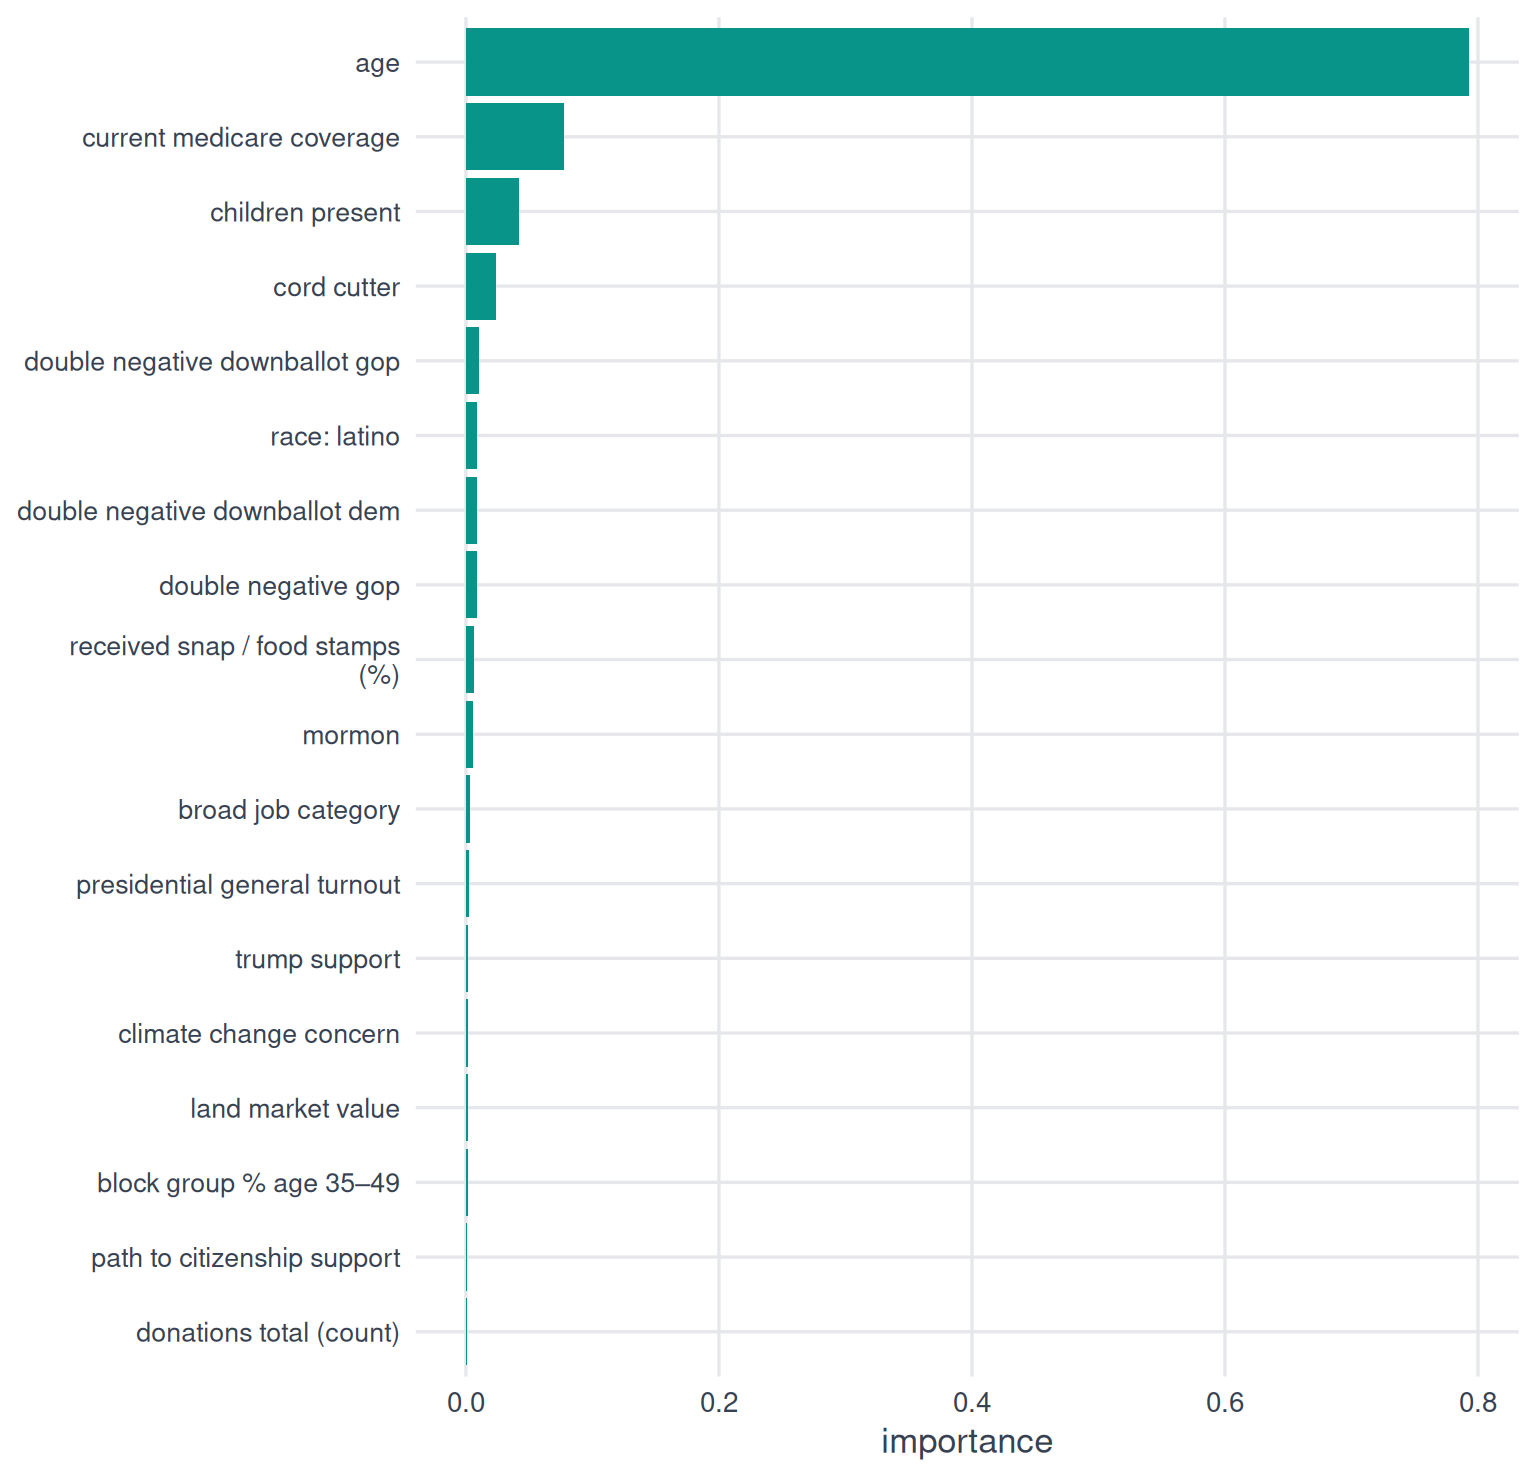
Importance
Sourcing
Agency for Healthcare Research and Quality
- received snap / food stamps (%)
Attom Property Data API
- land market value
OpenSecrets
- donations total (count)
Revelio Labs
- broad job category
State voter files (via TargetSmart)
- age
TargetSmart
- children present score
- climate change concern score
- cord cutter score
- double negative downballot dem score
- double negative downballot gop score
- double negative gop score
- mormon score
- path to citizenship support score
- presidential general turnout score
- race: latino
- trump support score
U.S. Census American Community Survey
- block group % age 35–49
Implementation
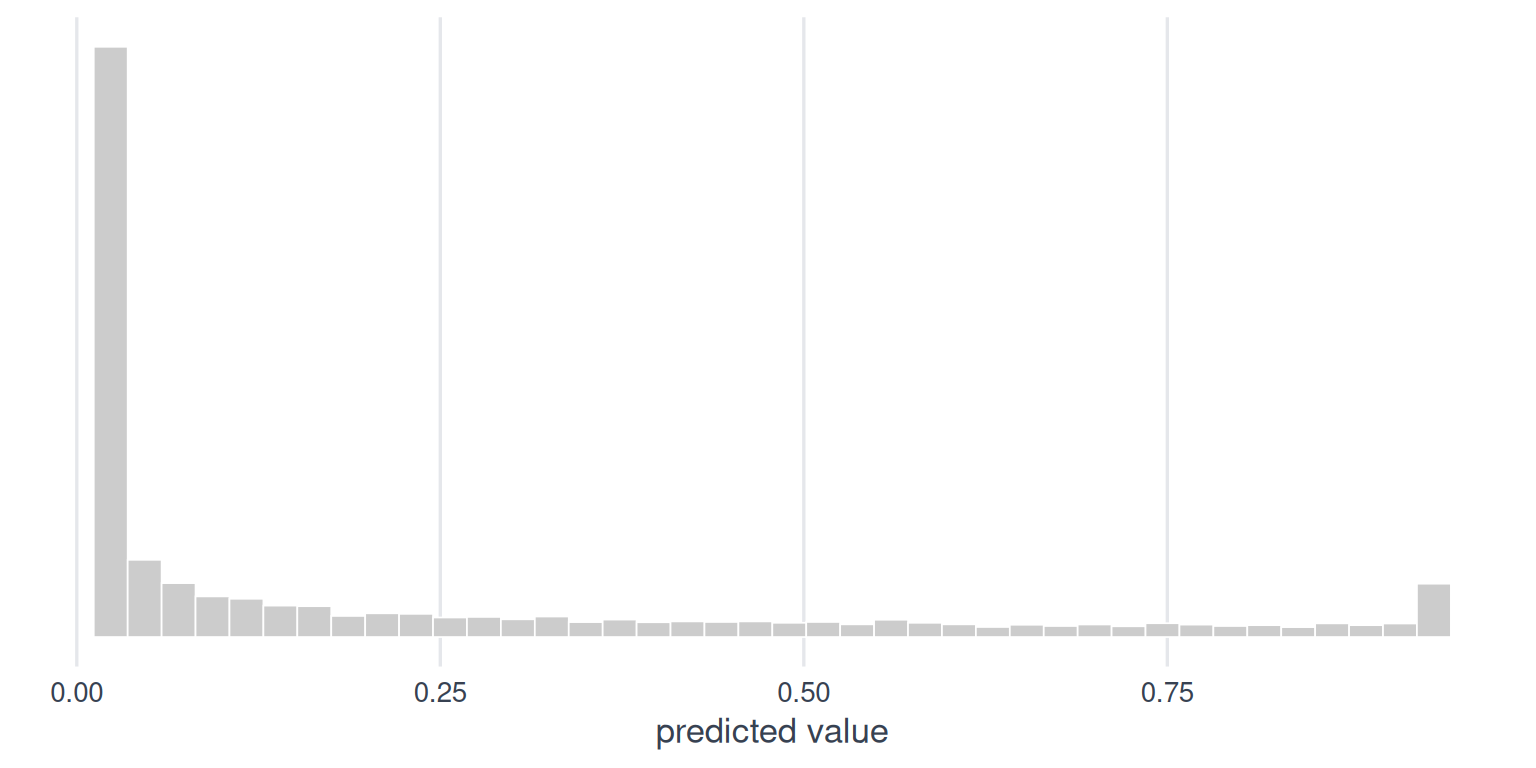
Prediction distribution
| statistic | value |
|---|---|
| mean | 0.23 |
| std dev | 0.30 |
| min | 0.03 |
| 25th | 0.04 |
| median | 0.05 |
| 75th | 0.35 |
| max | 0.94 |
Segments
| segment | lowest score | highest score | share of records |
|---|---|---|---|
| Most likely | 0.44 | 0.94 | 22.8% |
| Somewhat likely | 0.06 | 0.43 | 24.0% |
| Least likely | 0.03 | 0.05 | 53.2% |
External validity
Our model indicates that 23% of people with scored records are enrolled in Medicare. CMS Medicare Enrollment Dashboard and KFF Medicare place Medicare enrollment at roughly 25% of U.S. adults nationally (driven by adults 65+, plus younger disability-based enrollees).