| metric | value |
|---|---|
| area under ROC curve | 0.76 |
| area under precision-recall curve | 0.38 |
| accuracy | 0.59 |
| precision | 0.25 |
| recall | 0.79 |
| f1 score | 0.38 |
| mean log loss | 0.78 |
| gini coefficient | 0.52 |
| brier skill score | 0.14 |
utility shut-off warning
Overview
This model predicts whether a household has received a utility shut-off warning — a strong signal of acute financial distress.
Trained on survey data, it combines household composition indicators, geographic context, and income-level features to identify voters at risk of energy insecurity.
Organizations can use these scores to connect at-risk households with utility assistance programs and energy affordability advocacy.
- approach: dnn classifier
- training rows: 5,467
- last updated: 2026-09-14 00:47:37
Validation
Lift Chart
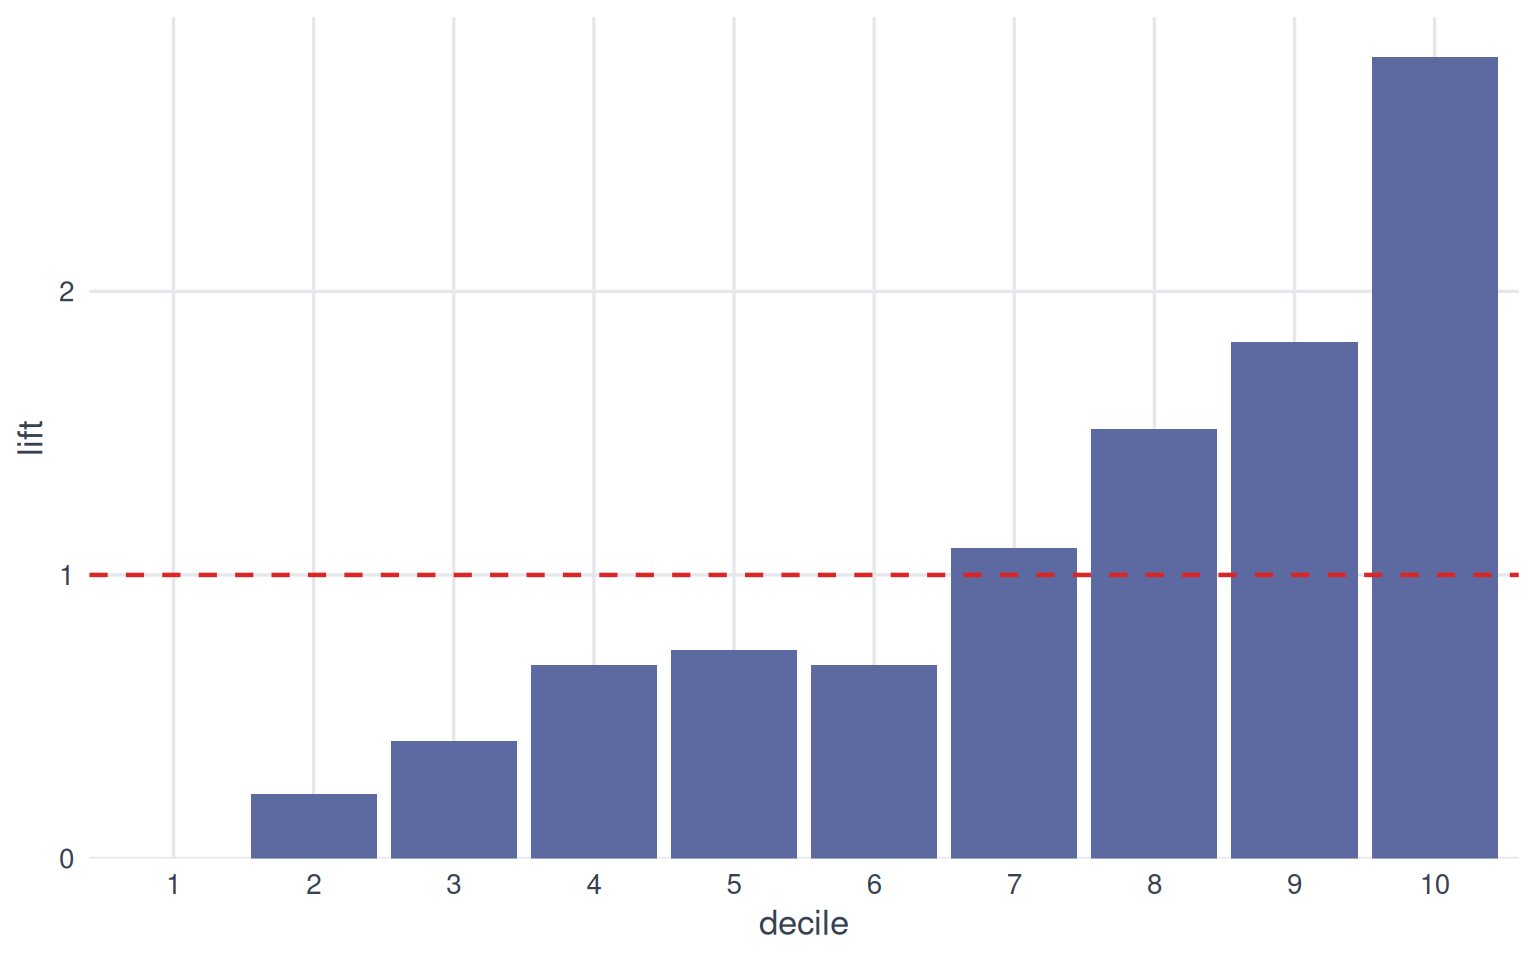
Each bar shows how much more common the outcome is within a score decile than in the population overall. Bars taller than the dashed line (lift of 1) mean the model’s top-ranked groups concentrate the outcome; a steady decline from decile 1 to 10 indicates the model is ranking effectively.
Calibration Plot
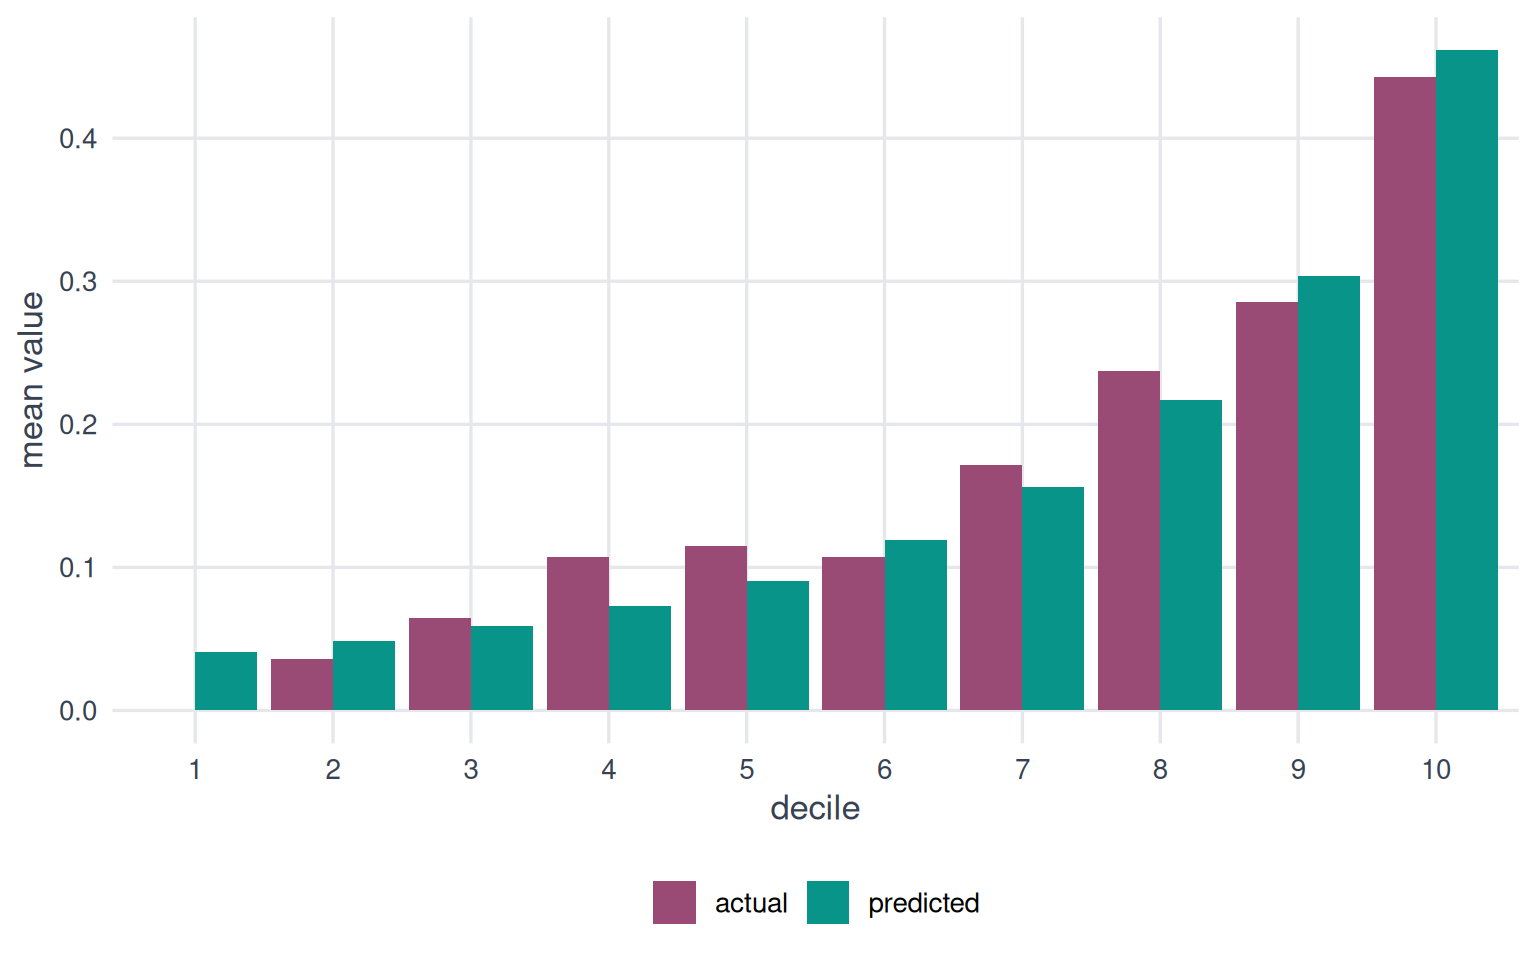
Bars of similar height within each decile indicate well-calibrated predictions. Systematic differences reveal where the model over- or under-predicts.
Cumulative Gains
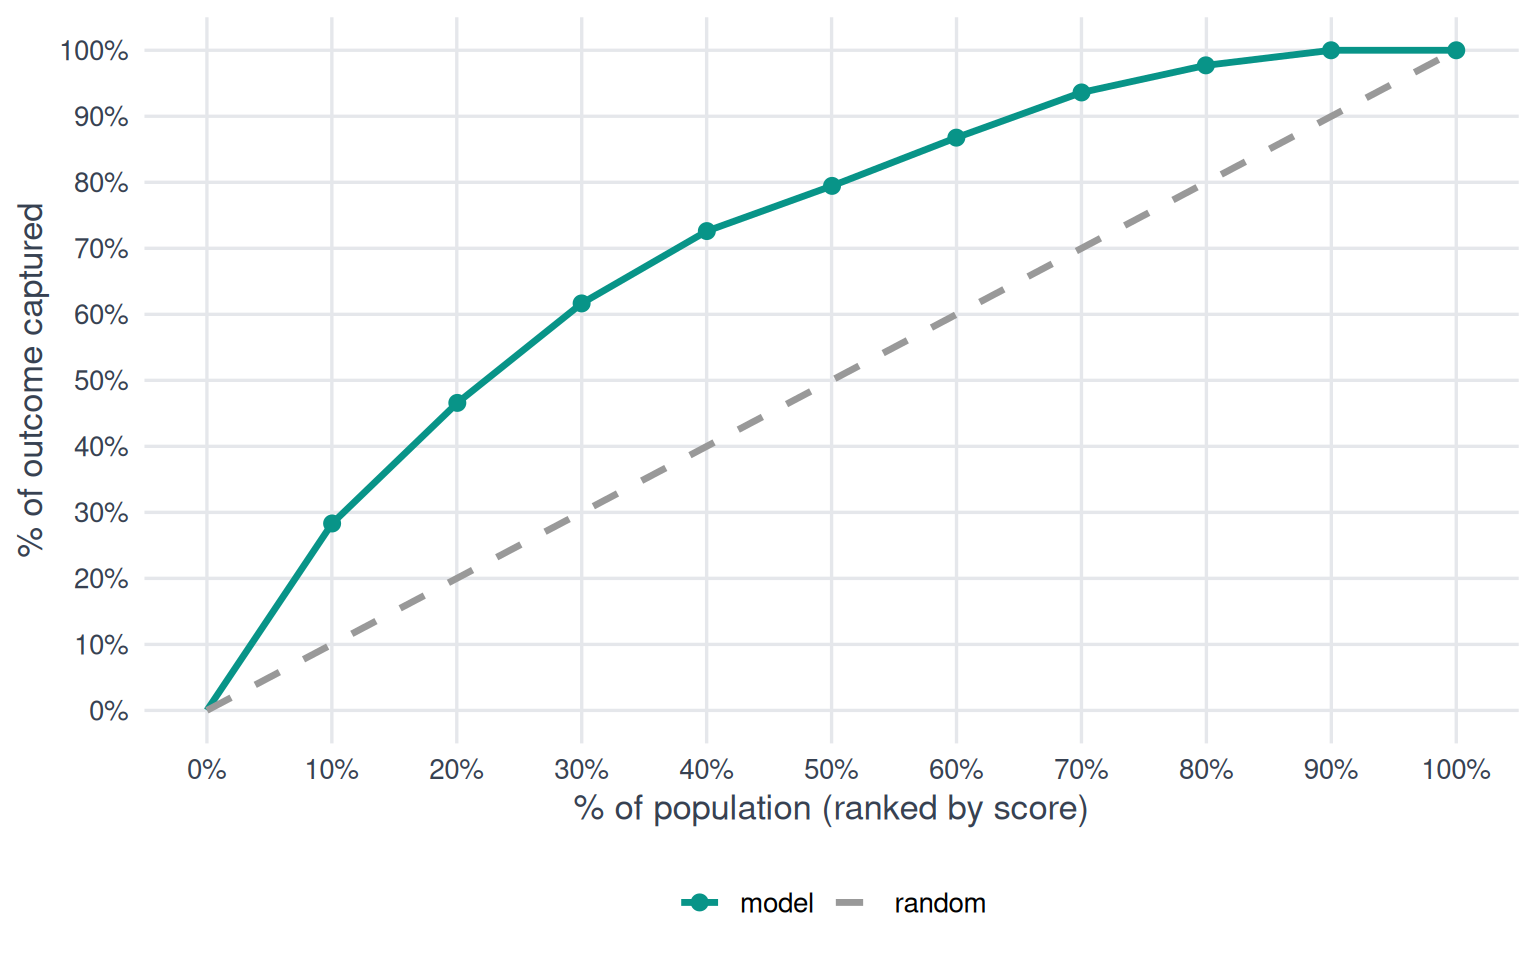
The further the model curve bows above the diagonal, the better the model concentrates the outcome in its top-ranked predictions.
Decile Analysis Table
| decile | count | mean actual | mean predicted | mae | lift |
|---|---|---|---|---|---|
| 10 | 140 | 0.44 | 0.46 | 0.02 | 2.83 |
| 9 | 140 | 0.29 | 0.30 | 0.02 | 1.82 |
| 8 | 139 | 0.24 | 0.22 | 0.02 | 1.51 |
| 7 | 140 | 0.17 | 0.16 | 0.02 | 1.09 |
| 6 | 140 | 0.11 | 0.12 | 0.01 | 0.68 |
| 5 | 139 | 0.12 | 0.09 | 0.02 | 0.73 |
| 4 | 140 | 0.11 | 0.07 | 0.03 | 0.68 |
| 3 | 139 | 0.06 | 0.06 | 0.006 | 0.41 |
| 2 | 140 | 0.04 | 0.05 | 0.01 | 0.23 |
| 1 | 140 | 0 | 0.04 | 0.04 | 0.00 |
Architecture
This model is a deep neural network classifier trained with BigQuery ML.
Hyperparameter configuration
- optimizer: adam
- max iterations: 20
- learn rate: 0.0011
- l1 regularization: 0
- l2 regularization: 0
- min relative progress: 0.01
- warm start: FALSE
- early stop: TRUE
- input label columns: affordability_utility_shut_off_warning
- data split method: AUTO_SPLIT
- hidden units: 32, 16
- batch size: 16
- dropout: 0.3273
- num trials: 18
- max parallel trials: 5
- hparam tuning objectives: ROC_AUC
- enable global explain: FALSE
- tf version: 1.15
- activation fn: relu
- auto class weights: FALSE
Features
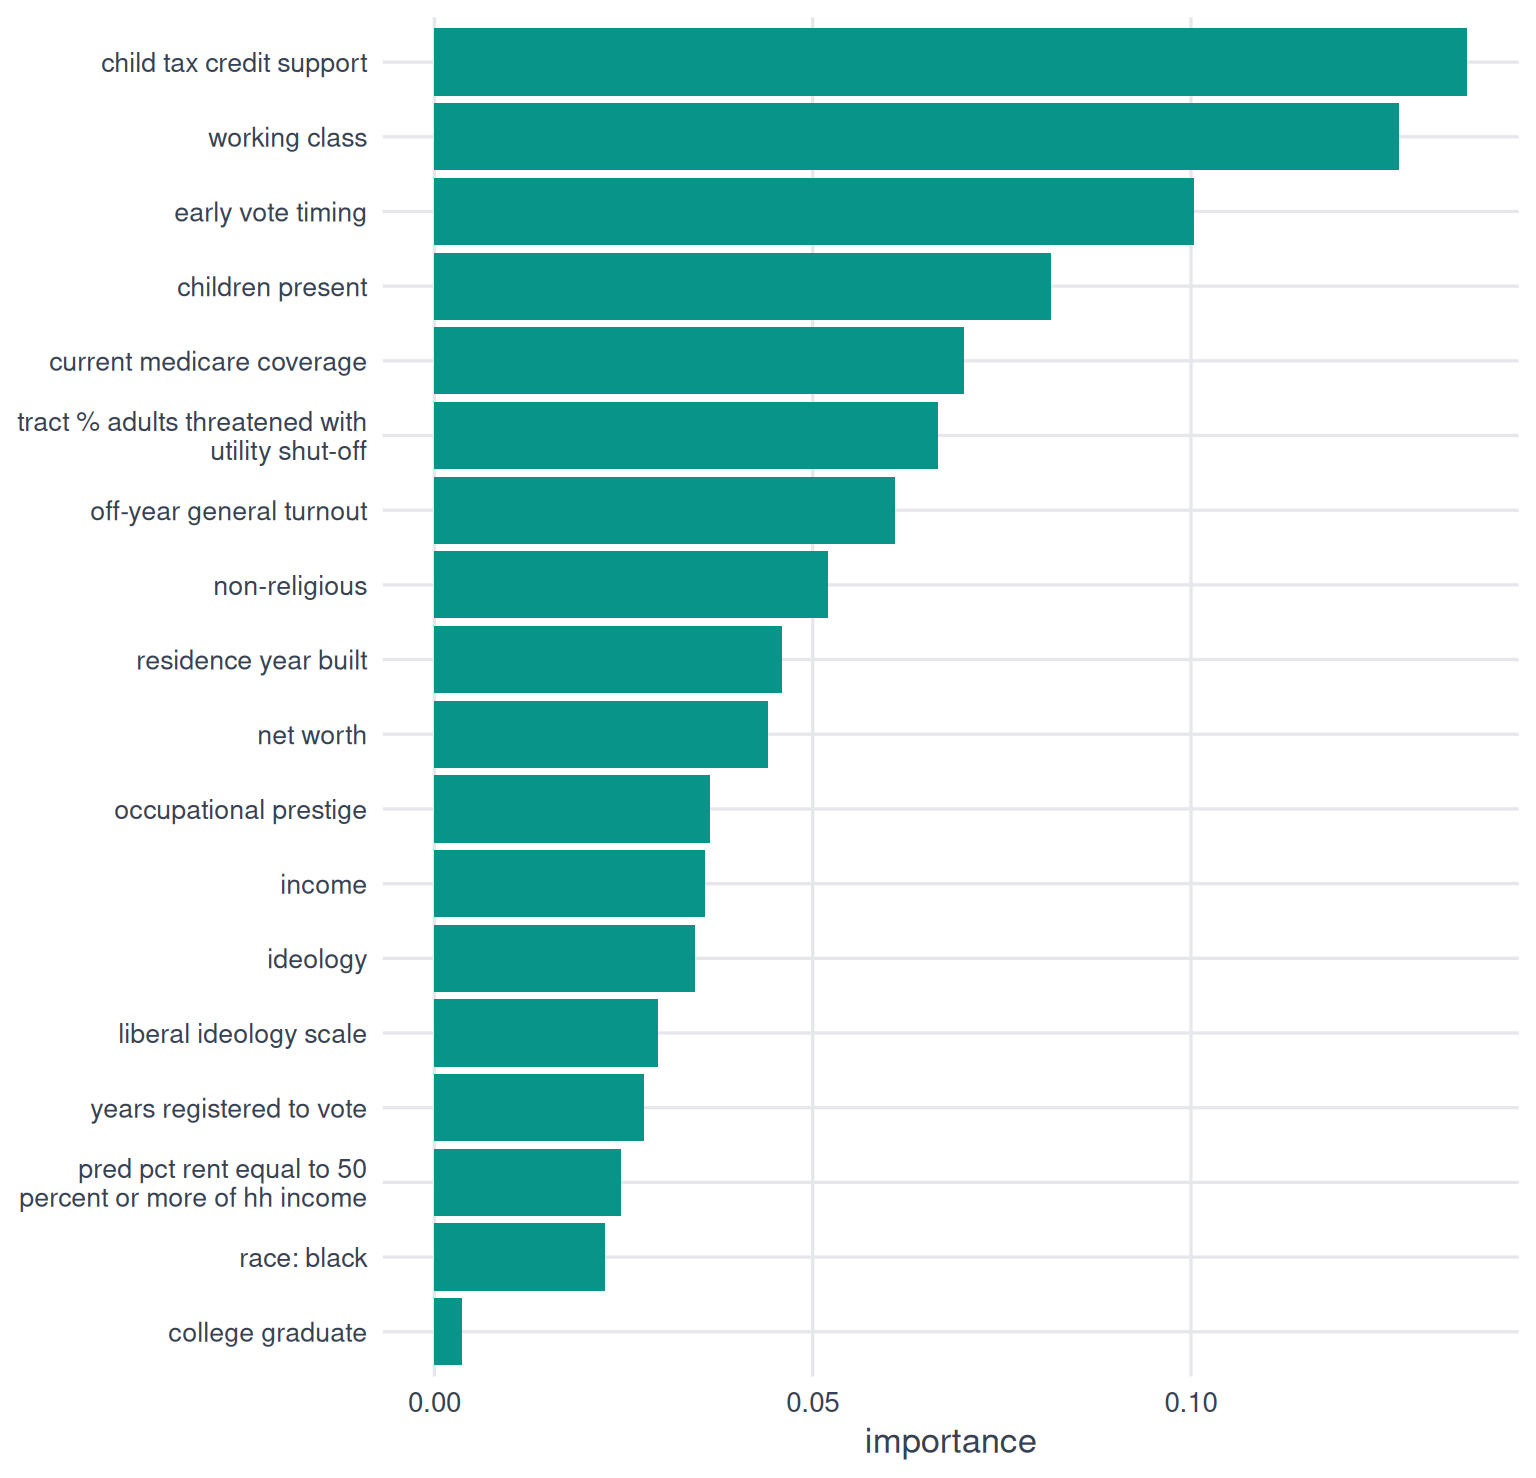
Importance
Sourcing
CDC PLACES
- tract % adults threatened with utility shut-off
Revelio Labs
- occupational prestige score
State voter files (via TargetSmart)
- years registered to vote
TargetSmart
- child tax credit support score
- children present score
- college graduate score
- early vote timing score
- ideology score
- non-religious score
- off-year general turnout score
- race: black
- working class score
unknown
- pred pct rent equal to 50 percent or more of hh income
Verisk (via TargetSmart)
- income
- liberal ideology scale
- net worth
- residence year built
Implementation
Prediction distribution
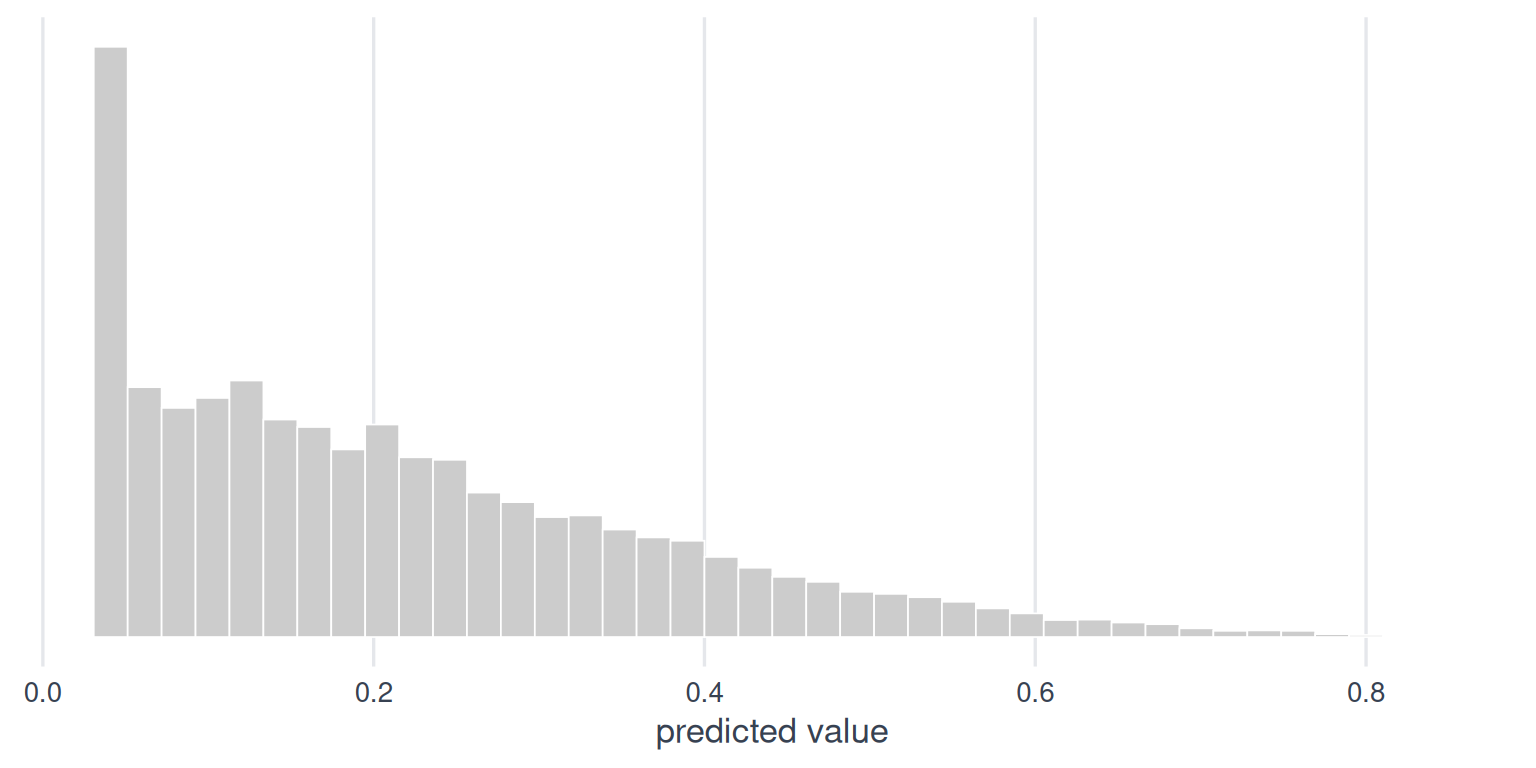
| statistic | value |
|---|---|
| mean | 0.21 |
| std dev | 0.16 |
| min | 0.04 |
| 25th | 0.08 |
| median | 0.16 |
| 75th | 0.32 |
| max | 0.84 |
Segments
| segment | lowest score | highest score | share of records |
|---|---|---|---|
| Most likely | 0.36 | 0.84 | 21.4% |
| Somewhat likely | 0.21 | 0.35 | 20.7% |
| Least likely | 0.04 | 0.20 | 58.0% |
External validity
Our model indicates that 21% of people with scored records have received a utility shut-off warning in the past year. In 2025, 21.5M U.S. households (~16%) were behind on utility bills (2025 NEADA). Utility bills have been rising sharply, with an estimated 8.5% increase expected in 2026 (2026 NYT).