| metric | value |
|---|---|
| area under ROC curve | 0.78 |
| area under precision-recall curve | 0.73 |
| accuracy | 0.72 |
| precision | 0.68 |
| recall | 0.80 |
| f1 score | 0.74 |
| mean log loss | 0.55 |
| gini coefficient | 0.57 |
| brier skill score | 0.26 |
insurance: employer sponsored
WarningStaging
Built from the latest training run on 2026-09-30 17:45 UTC, not from a released model set. The released documentation is at https://matter.indigo.engineering/docs/.
Overview
This model predicts whether a voter receives health insurance through their employer.
Trained on survey data, it leverages age, income proxies, household composition, and employment signals to estimate employer-sponsored coverage.
These scores help organizations understand coverage patterns and target outreach around employer benefit standards, COBRA protections, and the relationship between employment and health care access.
- approach: boosted tree classifier
- training rows: 5,380
- last updated: 2026-09-06 19:54:53
Validation
Lift Chart
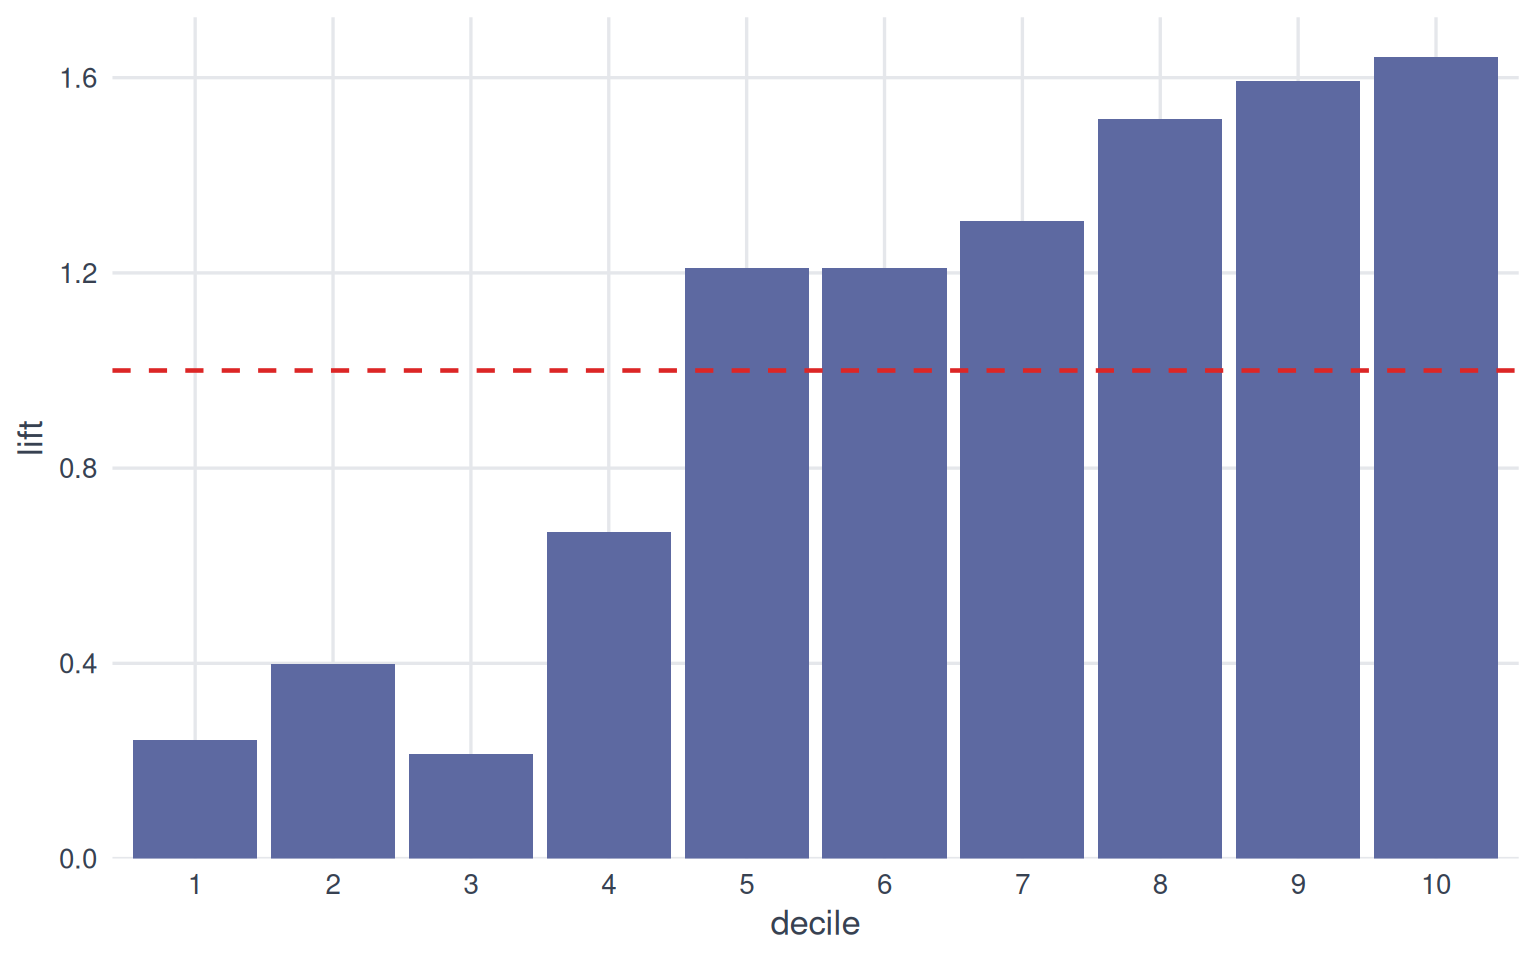
Each bar shows how much more common the outcome is within a score decile than in the population overall. Bars taller than the dashed line (lift of 1) mean the model’s top-ranked groups concentrate the outcome; a steady decline from decile 1 to 10 indicates the model is ranking effectively.
Calibration Plot
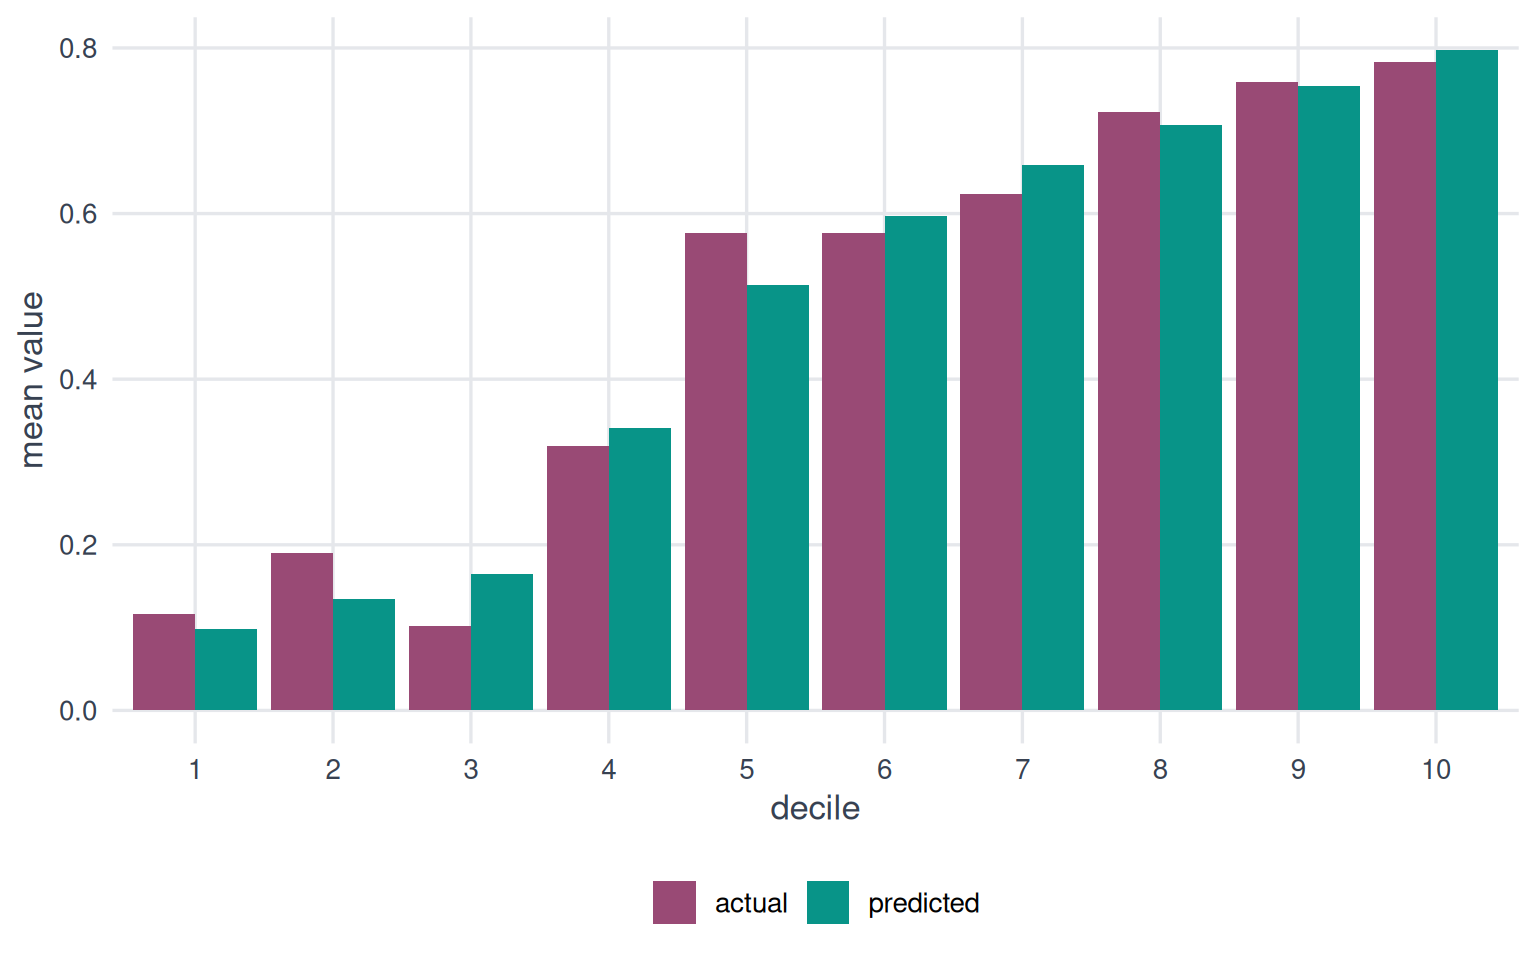
Bars of similar height within each decile indicate well-calibrated predictions. Systematic differences reveal where the model over- or under-predicts.
Cumulative Gains
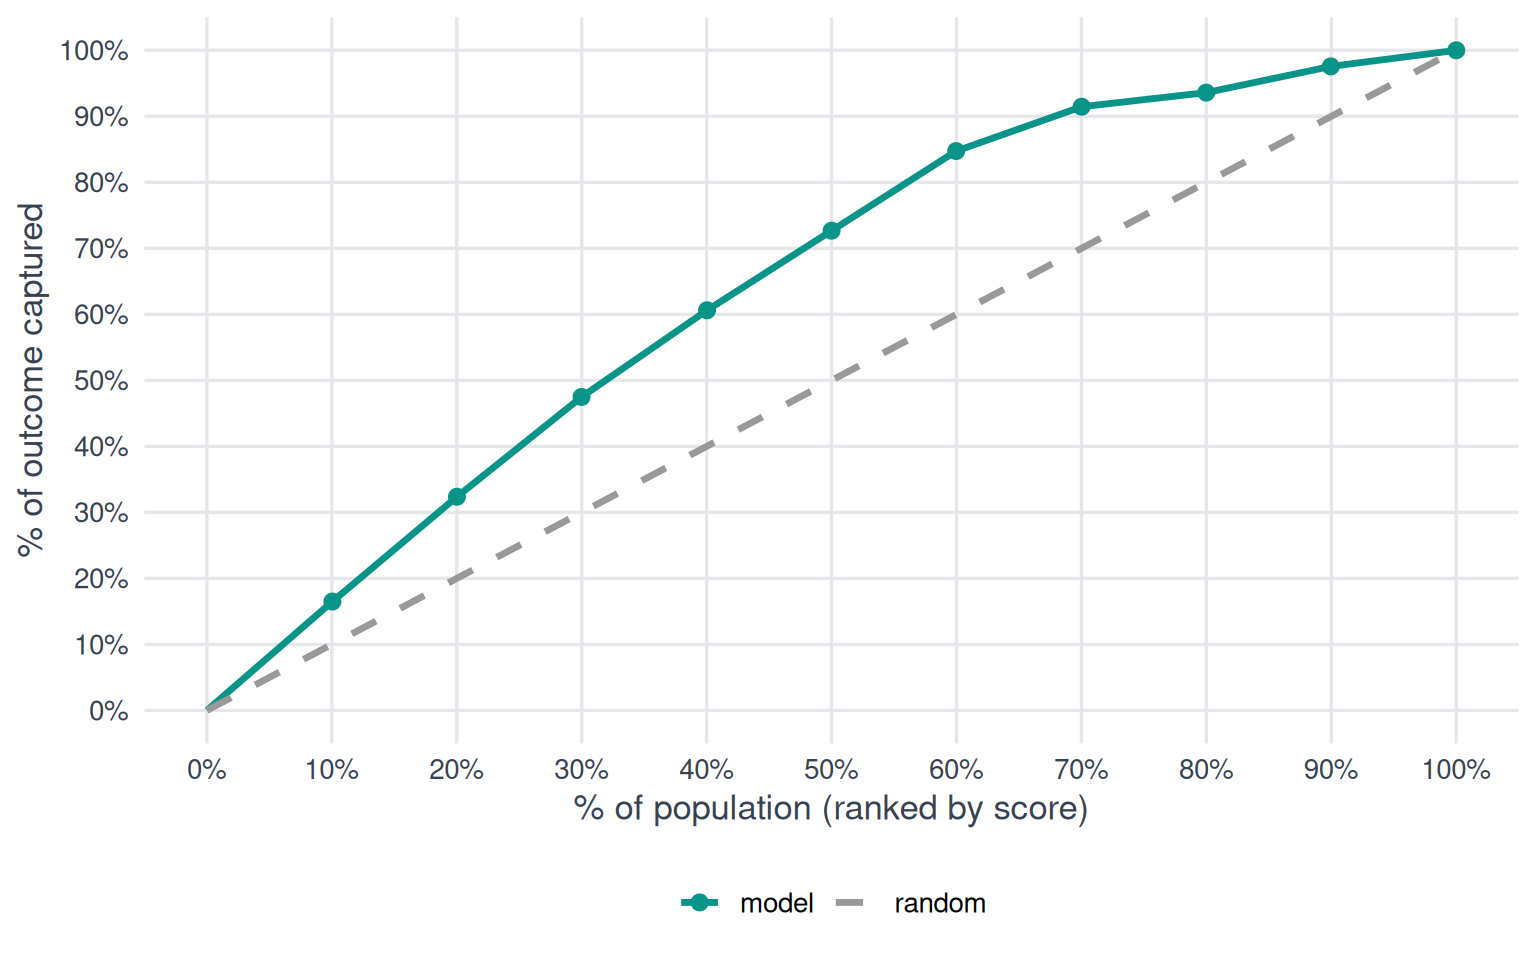
The further the model curve bows above the diagonal, the better the model concentrates the outcome in its top-ranked predictions.
Decile Analysis Table
| decile | count | mean actual | mean predicted | mae | lift |
|---|---|---|---|---|---|
| 10 | 138 | 0.78 | 0.80 | 0.01 | 1.64 |
| 9 | 137 | 0.76 | 0.75 | 0.005 | 1.59 |
| 8 | 137 | 0.72 | 0.71 | 0.02 | 1.52 |
| 7 | 138 | 0.62 | 0.66 | 0.04 | 1.31 |
| 6 | 137 | 0.58 | 0.60 | 0.02 | 1.21 |
| 5 | 137 | 0.58 | 0.51 | 0.06 | 1.21 |
| 4 | 138 | 0.32 | 0.34 | 0.02 | 0.67 |
| 3 | 137 | 0.10 | 0.17 | 0.06 | 0.21 |
| 2 | 137 | 0.19 | 0.13 | 0.06 | 0.40 |
| 1 | 138 | 0.12 | 0.10 | 0.02 | 0.24 |
Architecture
This model is a boosted-tree classifier trained with BigQuery ML.
Hyperparameter configuration
- max iterations: 20
- learn rate: 0.3033
- l1 regularization: 2.72e-11
- l2 regularization: 0.0488
- min relative progress: 0.01
- early stop: TRUE
- input label columns: health_insurance_employer_sponsored
- data split method: AUTO_SPLIT
- max tree depth: 3
- subsample: 0.8978
- min split loss: 0
- num trials: 12
- max parallel trials: 4
- hparam tuning objectives: ROC_AUC
- enable global explain: TRUE
- category encoding method: LABEL_ENCODING
- booster type: GBTREE
- num parallel tree: 1
- tree method: AUTO
- min tree child weight: 1
- instance weight column: sample_weight
- xgboost version: 0.9
- auto class weights: FALSE
Features
Importance
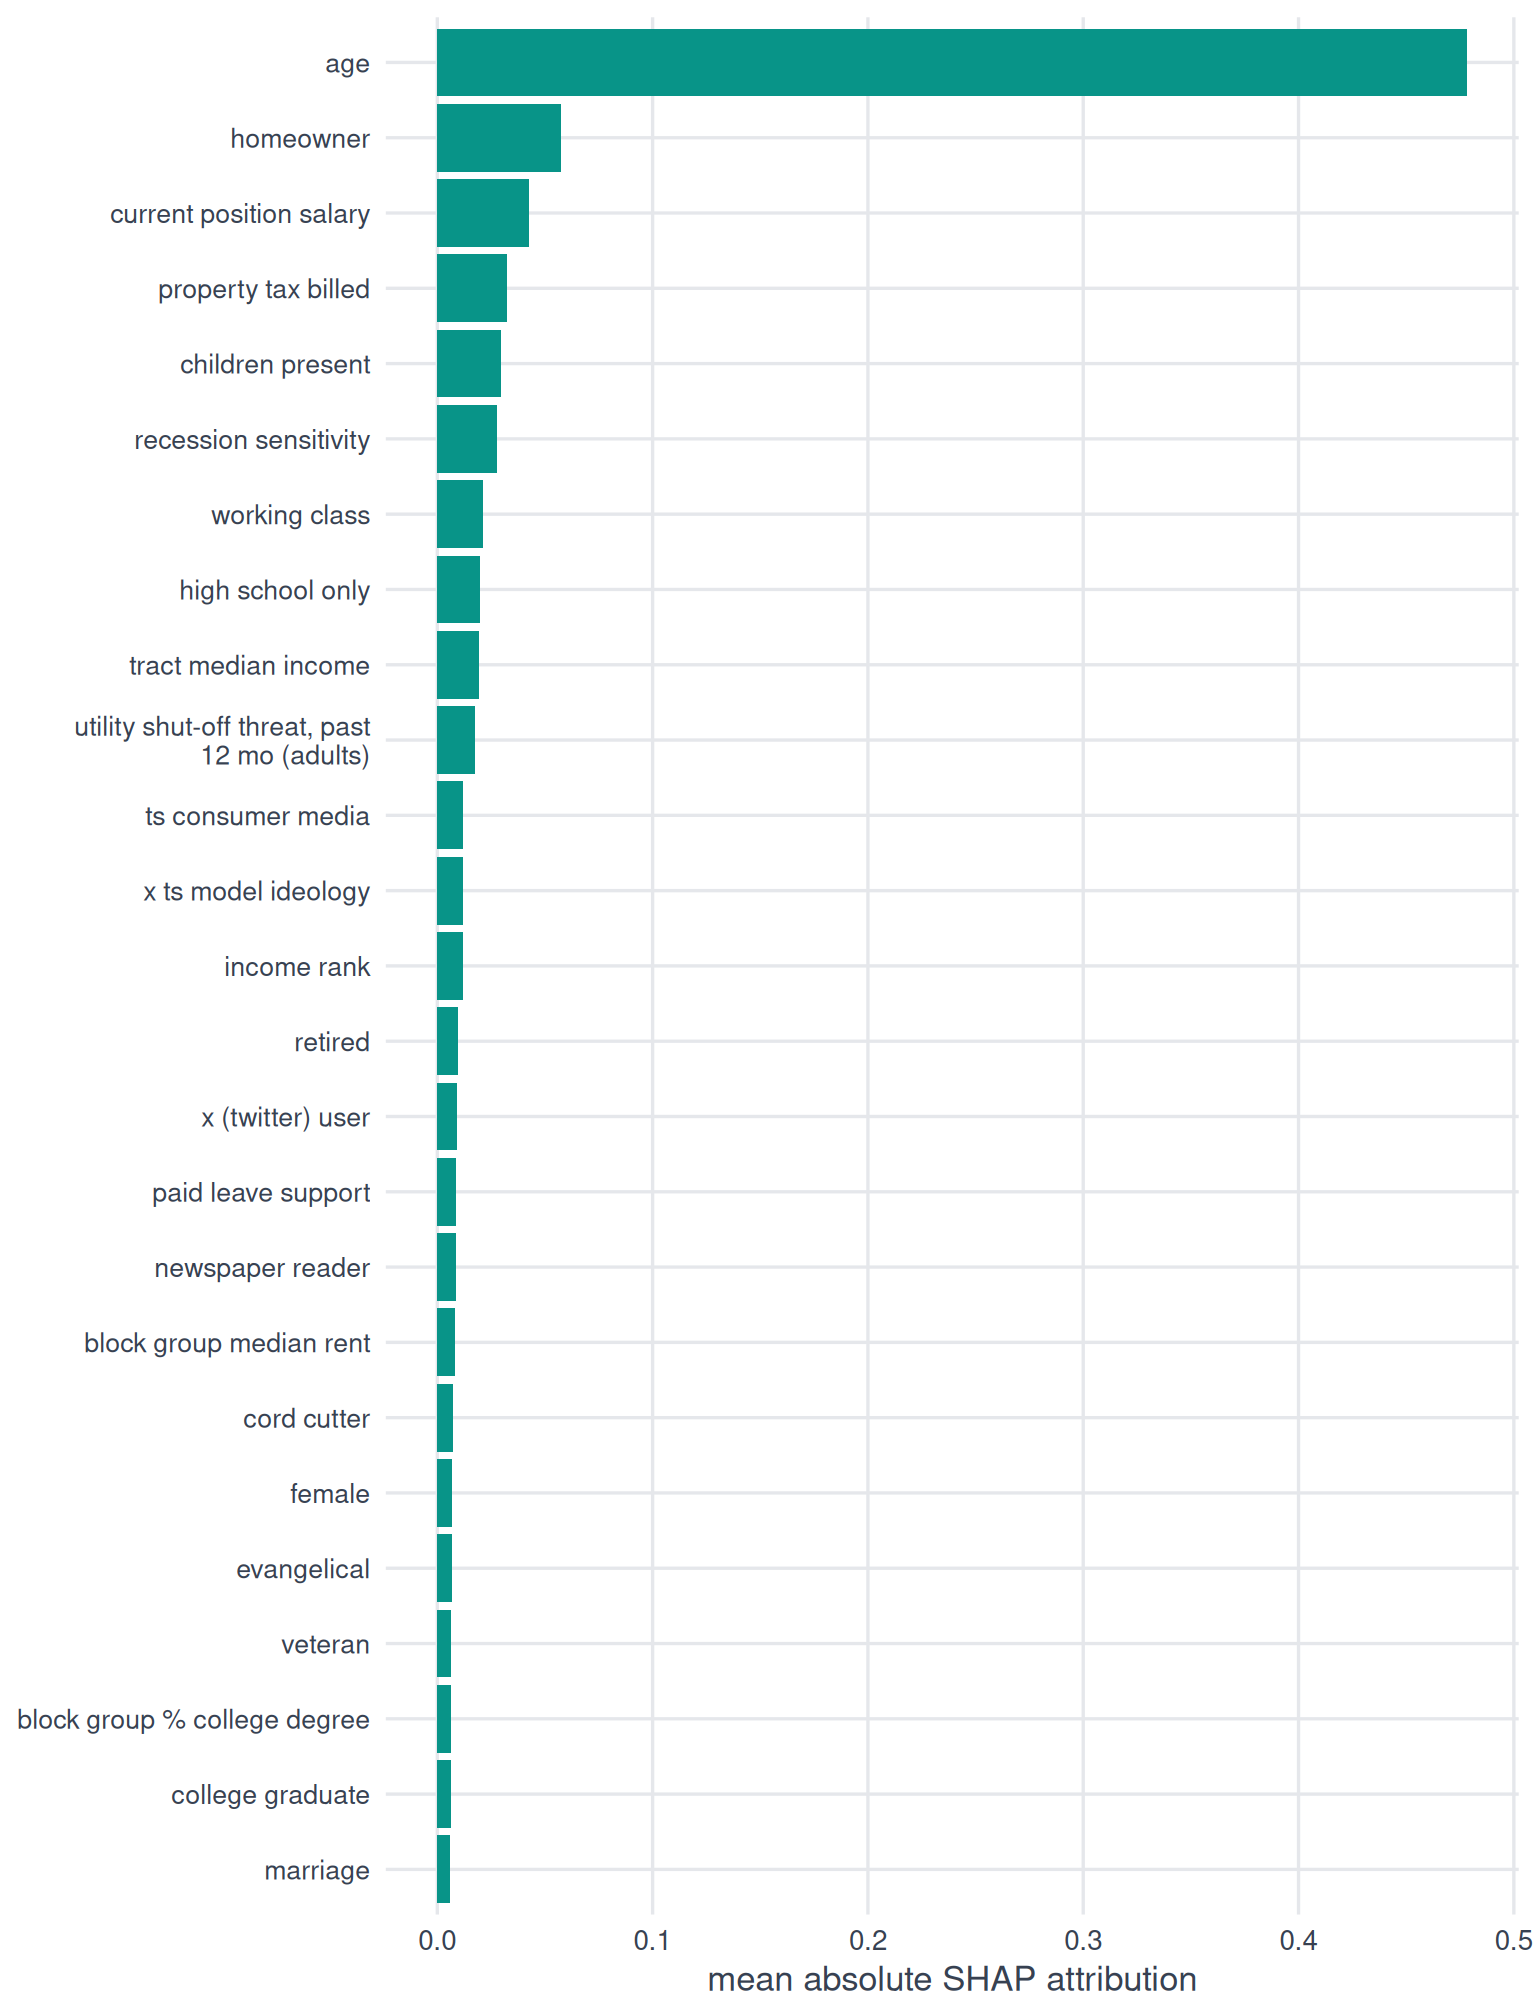
Interaction terms are split evenly between the features they combine.
Sourcing
Attom Property Data API
- property tax billed
CDC WONDER
- utility shut-off threat, past 12 mo (adults)
Revelio Labs
- current position salary
State voter files (via TargetSmart)
- age
- female
TargetSmart
- children present score
- college graduate score
- cord cutter score
- evangelical score
- high school only score
- income rank
- marriage score
- paid leave support score
- recession sensitivity score
- veteran score
- working class score
U.S. Census American Community Survey
- block group % college degree
- block group median rent
- tract median income
Verisk (via TargetSmart)
- homeowner
- newspaper reader
- retired
- x (twitter) user
Implementation
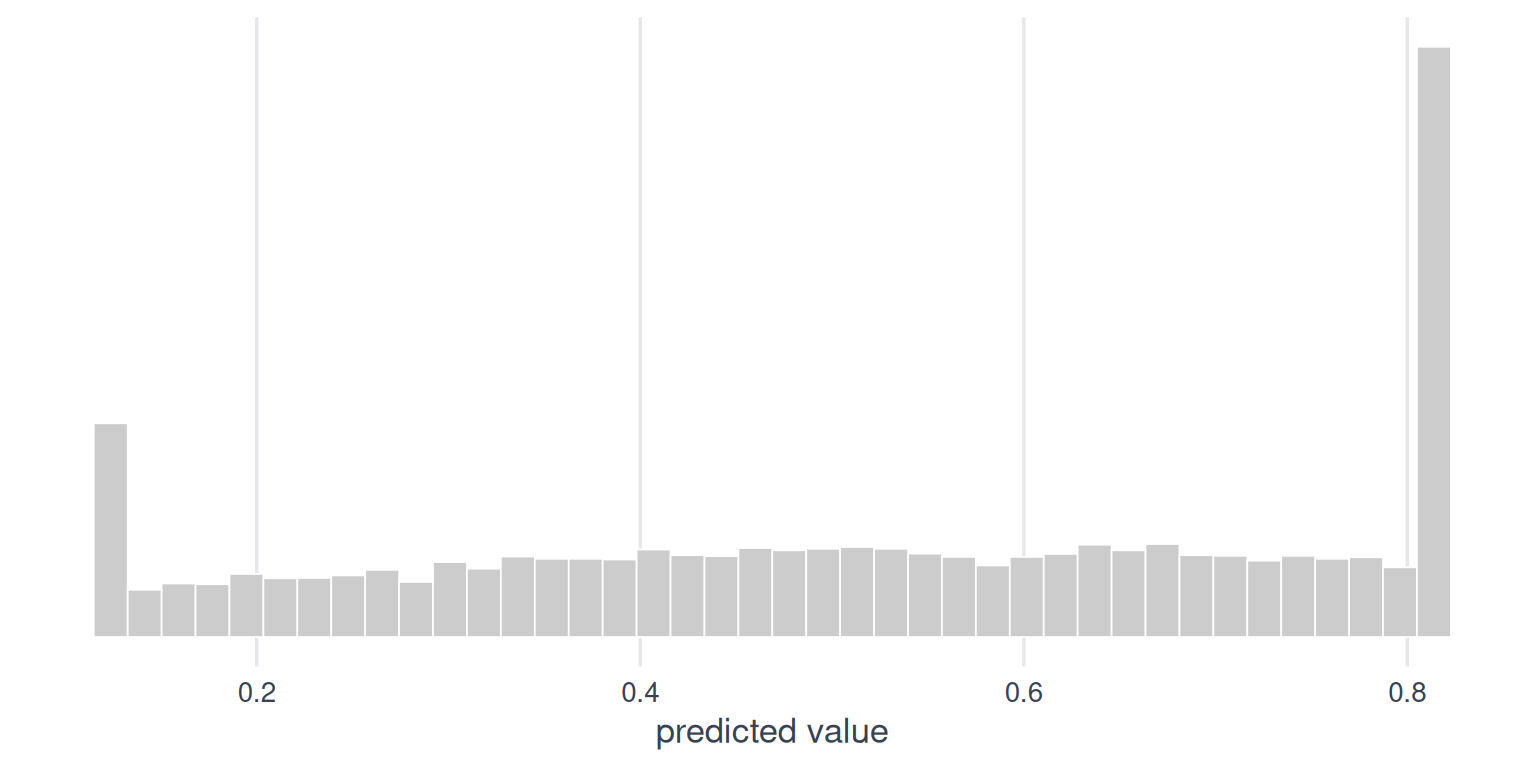
Prediction distribution
| statistic | value |
|---|---|
| mean | 0.53 |
| std dev | 0.24 |
| min | 0.13 |
| 25th | 0.21 |
| median | 0.62 |
| 75th | 0.74 |
| max | 0.82 |
Segments
| segment | lowest score | highest score | share of records |
|---|---|---|---|
| Most likely | 0.71 | 0.82 | 32.6% |
| Somewhat likely | 0.49 | 0.70 | 33.8% |
| Least likely | 0.13 | 0.48 | 33.6% |
External validity
Our model indicates that 53% of people with scored records have employer-sponsored health insurance. KFF Health Insurance Coverage of the Total Population and Census ACS 2023 (S2701) place employer-sponsored coverage at roughly 50% of U.S. adults.