| metric | value |
|---|---|
| area under ROC curve | 0.71 |
| area under precision-recall curve | 0.31 |
| accuracy | 0.56 |
| precision | 0.19 |
| recall | 0.73 |
| f1 score | 0.31 |
| mean log loss | 0.84 |
| gini coefficient | 0.41 |
| brier skill score | 0.07 |
enrolled in medicaid
WarningStaging
Built from the latest training run on 2026-09-30 17:45 UTC, not from a released model set. The released documentation is at https://matter.indigo.engineering/docs/.
Overview
This model predicts whether a voter is enrolled in Medicaid — the joint federal-state program providing health coverage to low-income individuals and families.
Trained on survey data and consuming AHRQ-derived ecological-disaggregation outputs as features, it functions primarily as a ranking tool, enabling organizations to prioritize voters who would materially benefit from Medicaid preservation or expansion.
- approach: deep learning
- training rows: 15,541
- last updated: 2026-08-29 19:49:51
Validation
Lift Chart
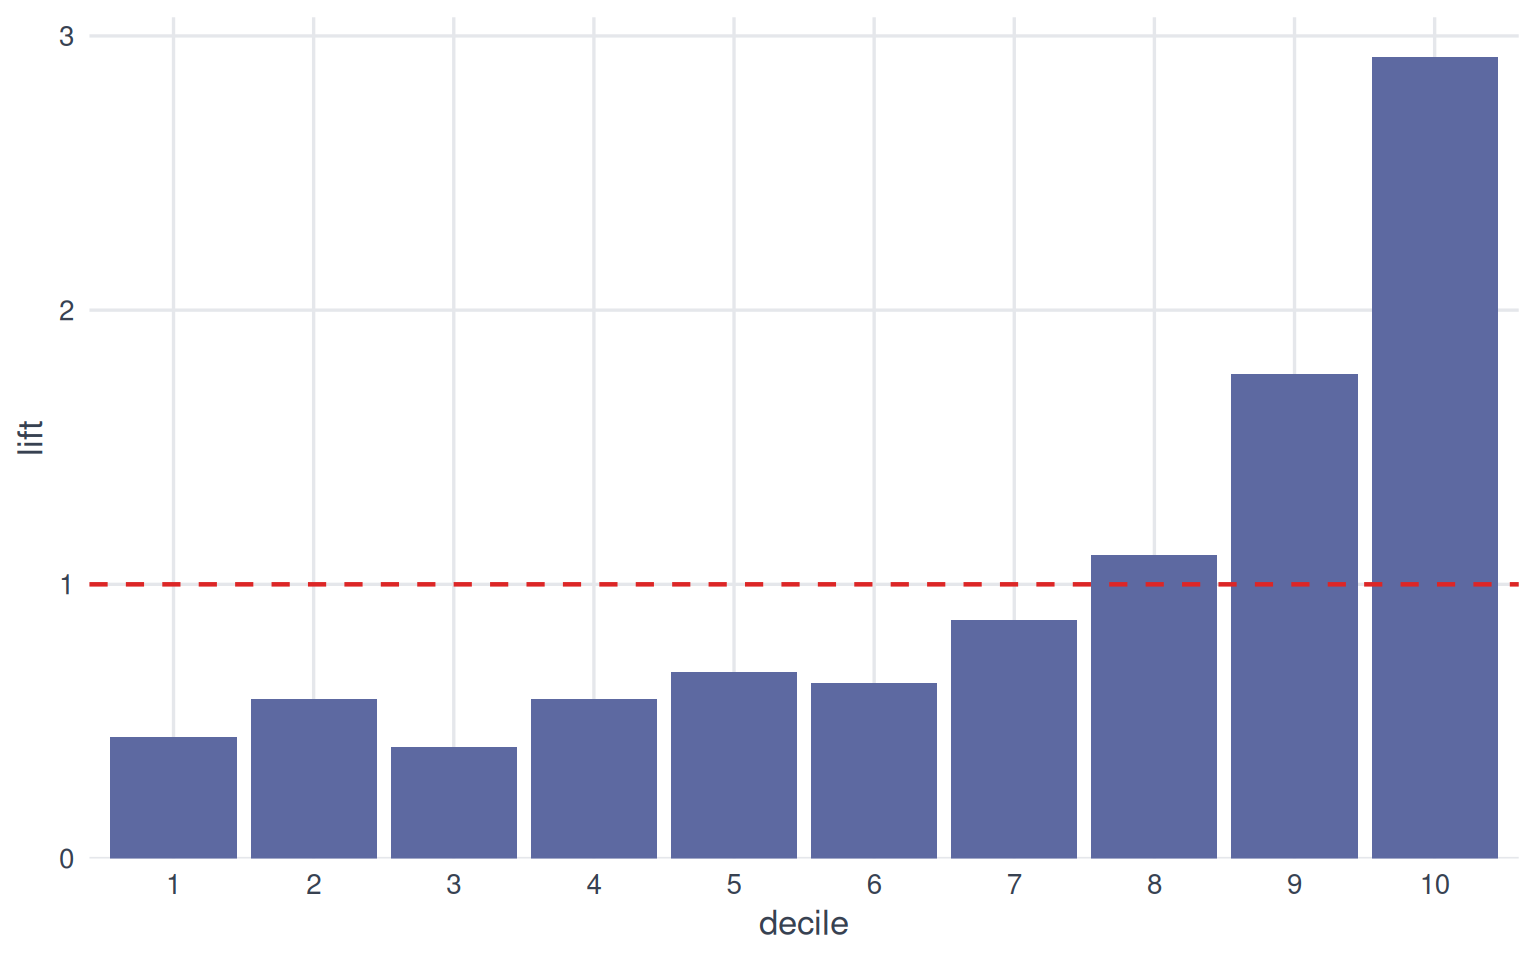
Each bar shows how much more common the outcome is within a score decile than in the population overall. Bars taller than the dashed line (lift of 1) mean the model’s top-ranked groups concentrate the outcome; a steady decline from decile 1 to 10 indicates the model is ranking effectively.
Calibration Plot
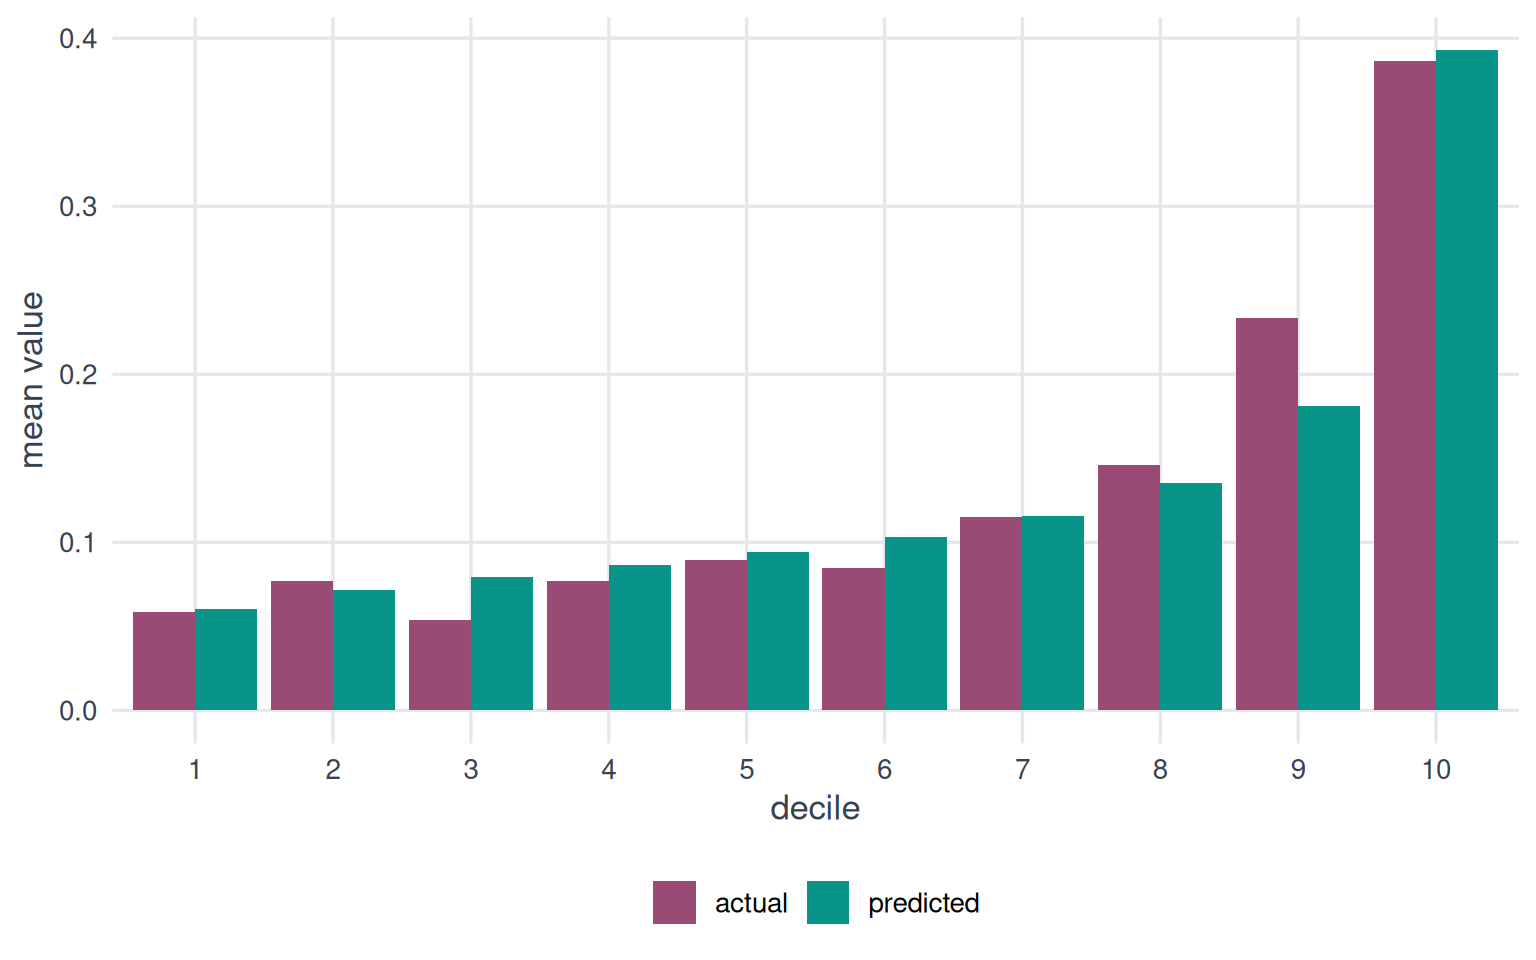
Bars of similar height within each decile indicate well-calibrated predictions. Systematic differences reveal where the model over- or under-predicts.
Cumulative Gains
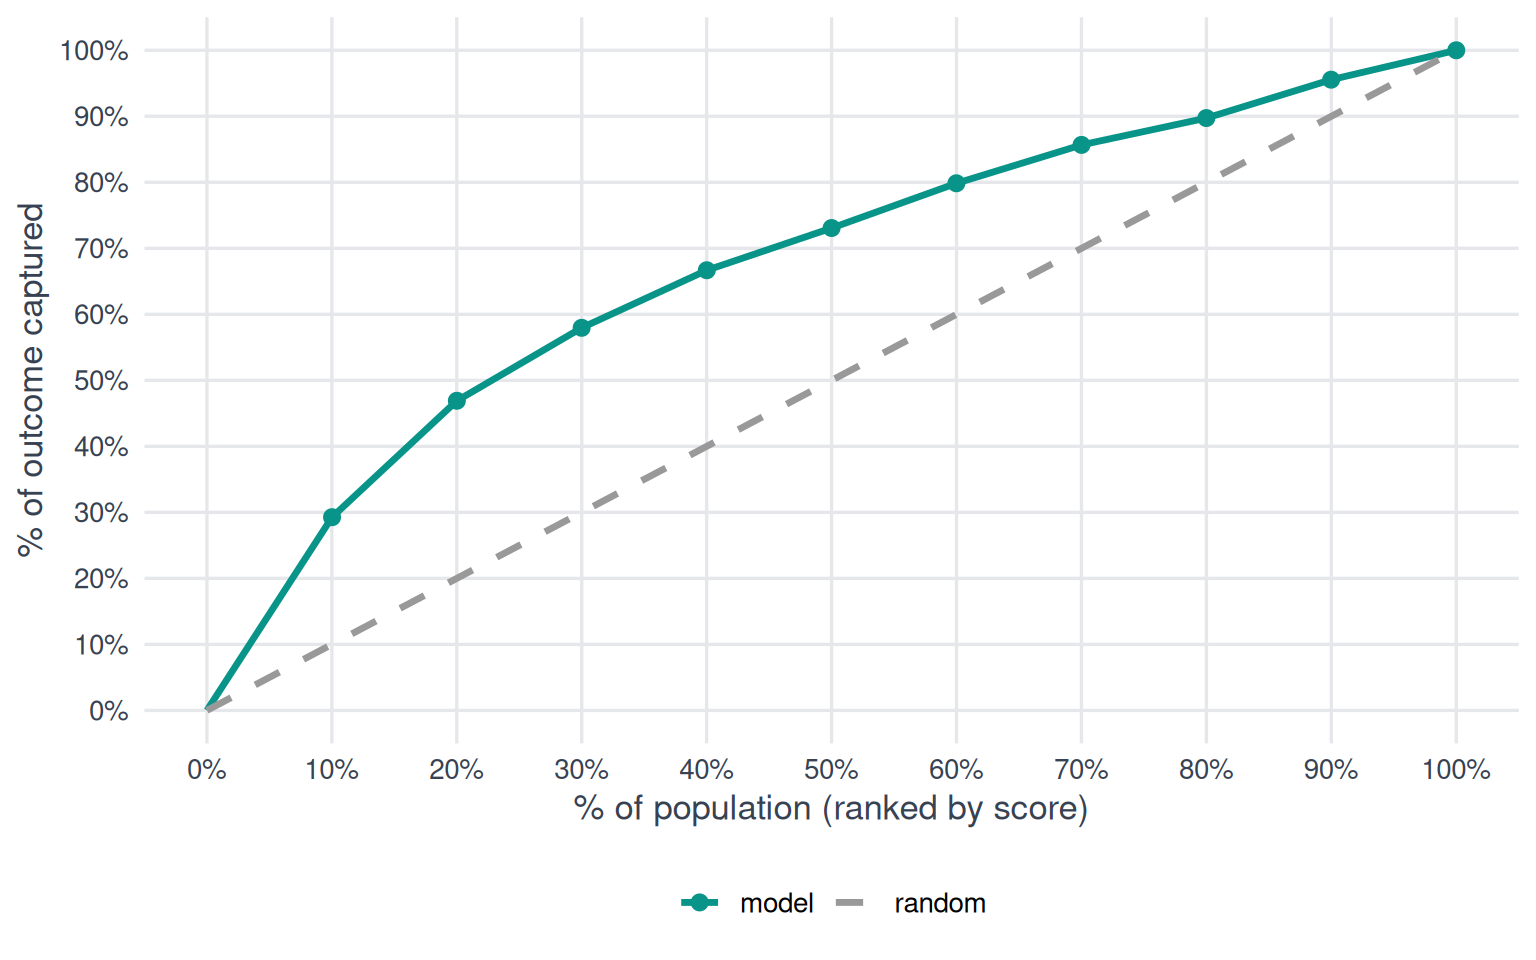
The further the model curve bows above the diagonal, the better the model concentrates the outcome in its top-ranked predictions.
Decile Analysis Table
| decile | count | mean actual | mean predicted | mae | lift |
|---|---|---|---|---|---|
| 10 | 391 | 0.39 | 0.39 | 0.007 | 2.92 |
| 9 | 390 | 0.23 | 0.18 | 0.05 | 1.77 |
| 8 | 390 | 0.15 | 0.14 | 0.01 | 1.11 |
| 7 | 391 | 0.12 | 0.12 | 0.0009 | 0.87 |
| 6 | 390 | 0.08 | 0.10 | 0.02 | 0.64 |
| 5 | 390 | 0.09 | 0.09 | 0.005 | 0.68 |
| 4 | 391 | 0.08 | 0.09 | 0.01 | 0.58 |
| 3 | 390 | 0.05 | 0.08 | 0.03 | 0.41 |
| 2 | 390 | 0.08 | 0.07 | 0.005 | 0.58 |
| 1 | 391 | 0.06 | 0.06 | 0.002 | 0.45 |
Architecture
This model is a deep neural network trained with TensorFlow.
Network structure
| layer | units | activation |
|---|---|---|
| ↓ dense | 96 | relu |
| ↓ batch normalization | ||
| ↓ dropout (0.30 rate) | ||
| ↓ dense | 70 | swish |
| ↓ batch normalization | ||
| ↓ dropout (0.20 rate) | ||
| ↓ dense | 44 | |
| ↓ batch normalization |
Hyperparameter configuration
- loss: binary_crossentropy
- optimizer: nadam
- batch size: 8
- activation: sigmoid
- label smoothing: 0.01
- learning rate: 0.001
Features
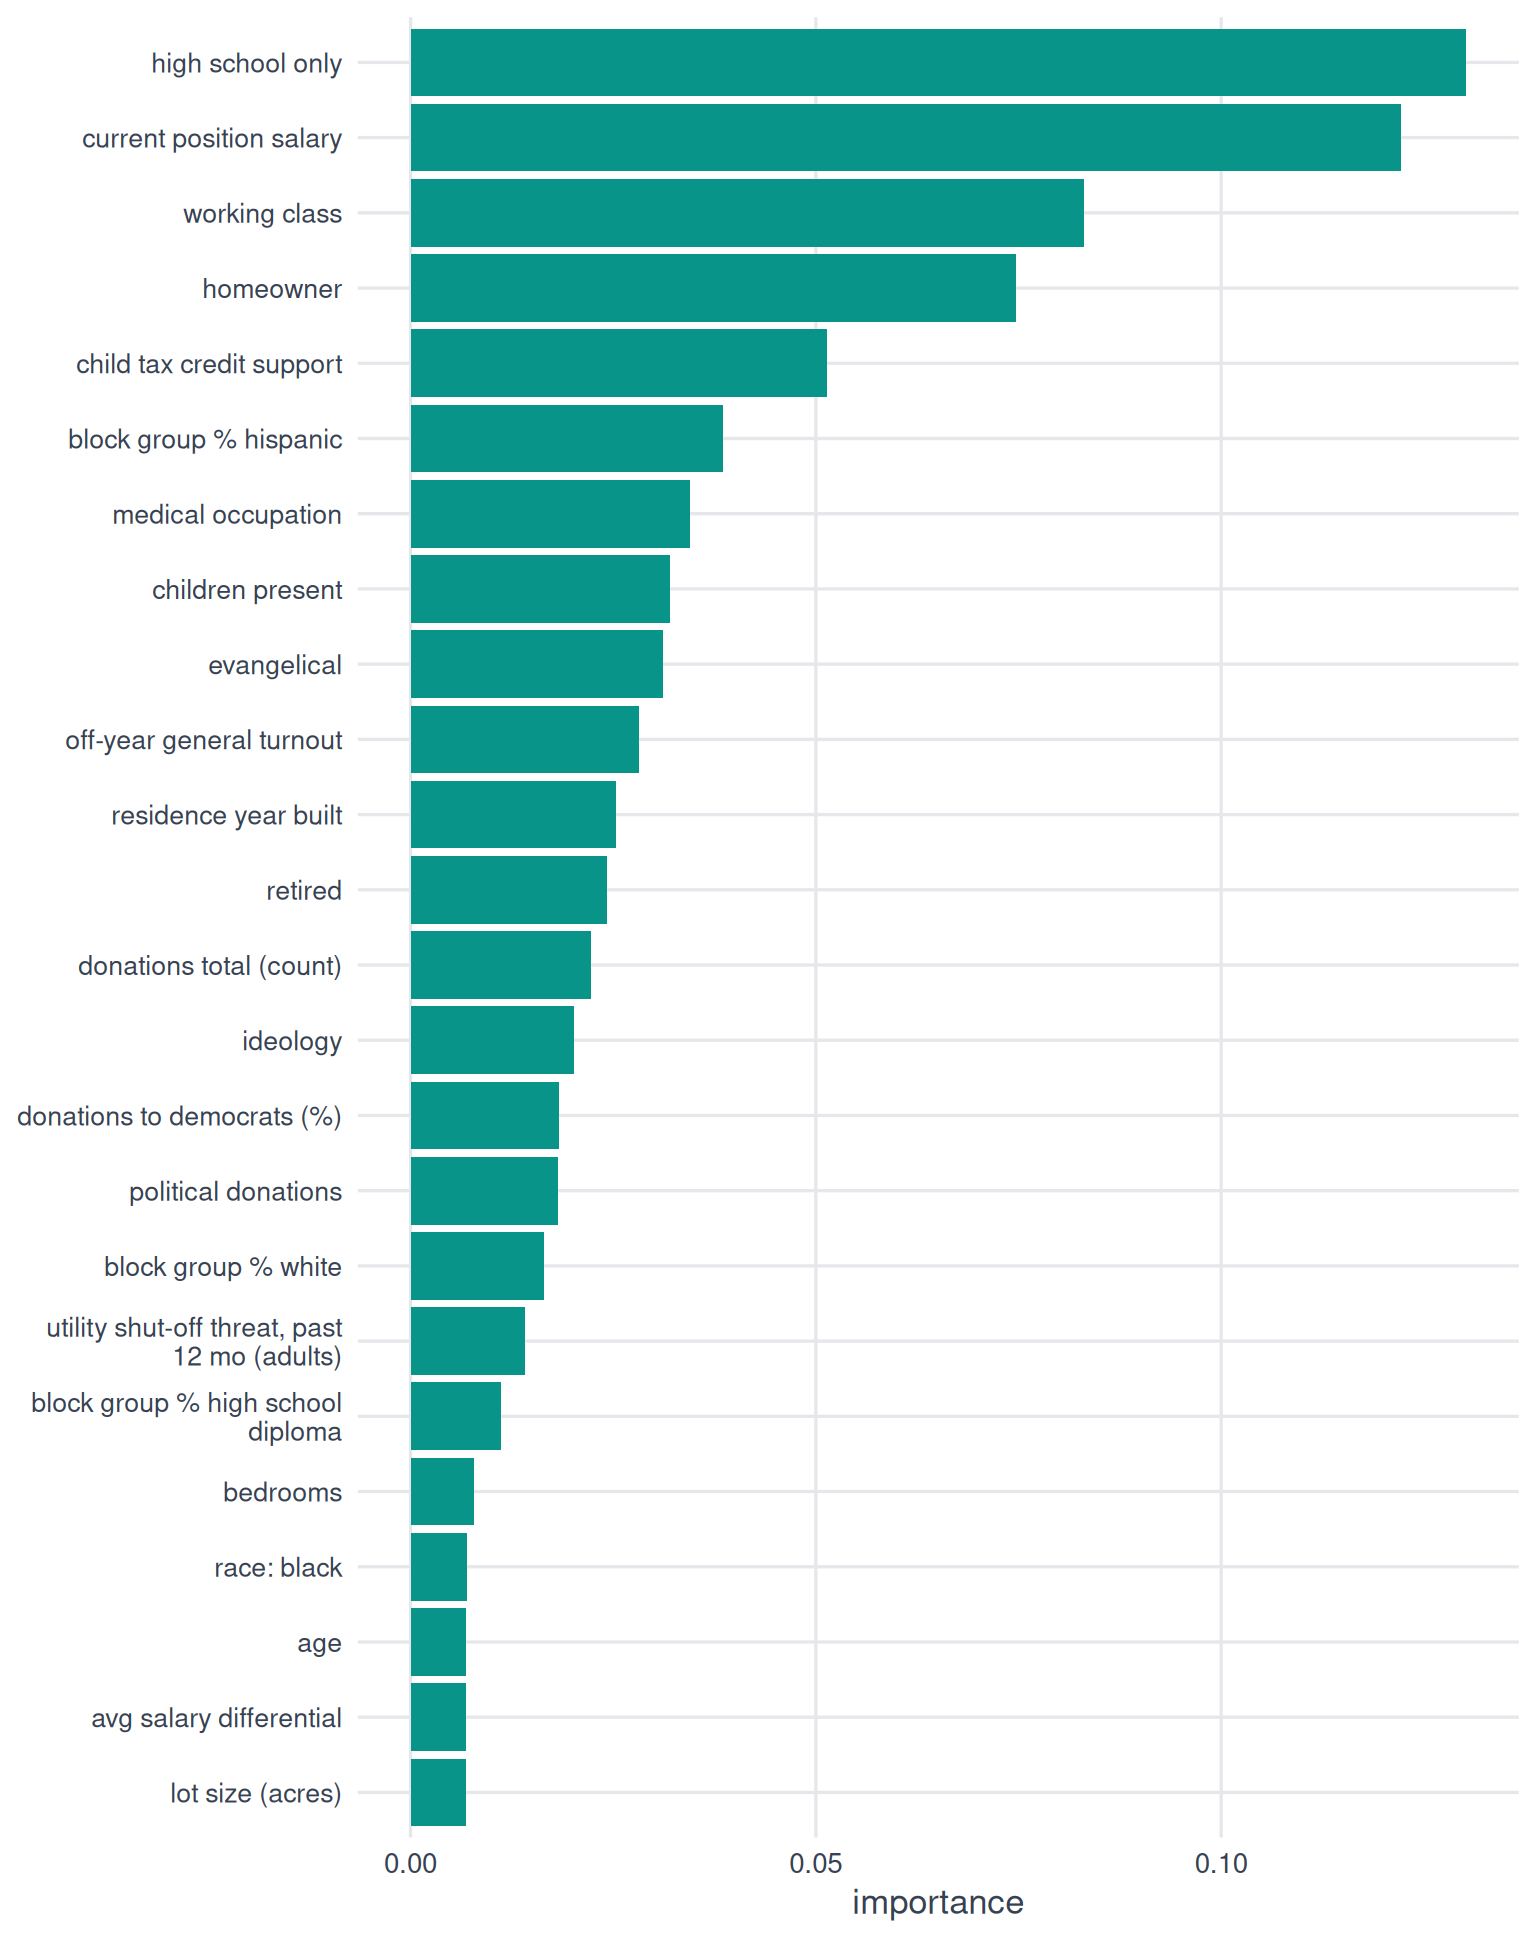
Importance
Sourcing
Attom Property Data API
- bedrooms
- lot size (acres)
CDC WONDER
- utility shut-off threat, past 12 mo (adults)
OpenSecrets
- donations to democrats (%)
- donations total (count)
Revelio Labs
- avg salary differential
- current position salary
State voter files (via TargetSmart)
- age
TargetSmart
- child tax credit support score
- children present score
- evangelical score
- high school only score
- homeowner score
- ideology score
- off-year general turnout score
- race: black
- working class score
U.S. Census American Community Survey
- block group % high school diploma
- block group % hispanic
- block group % white
Verisk (via TargetSmart)
- homeowner
- medical occupation
- political donations
- residence year built
- retired
Implementation
Prediction distribution
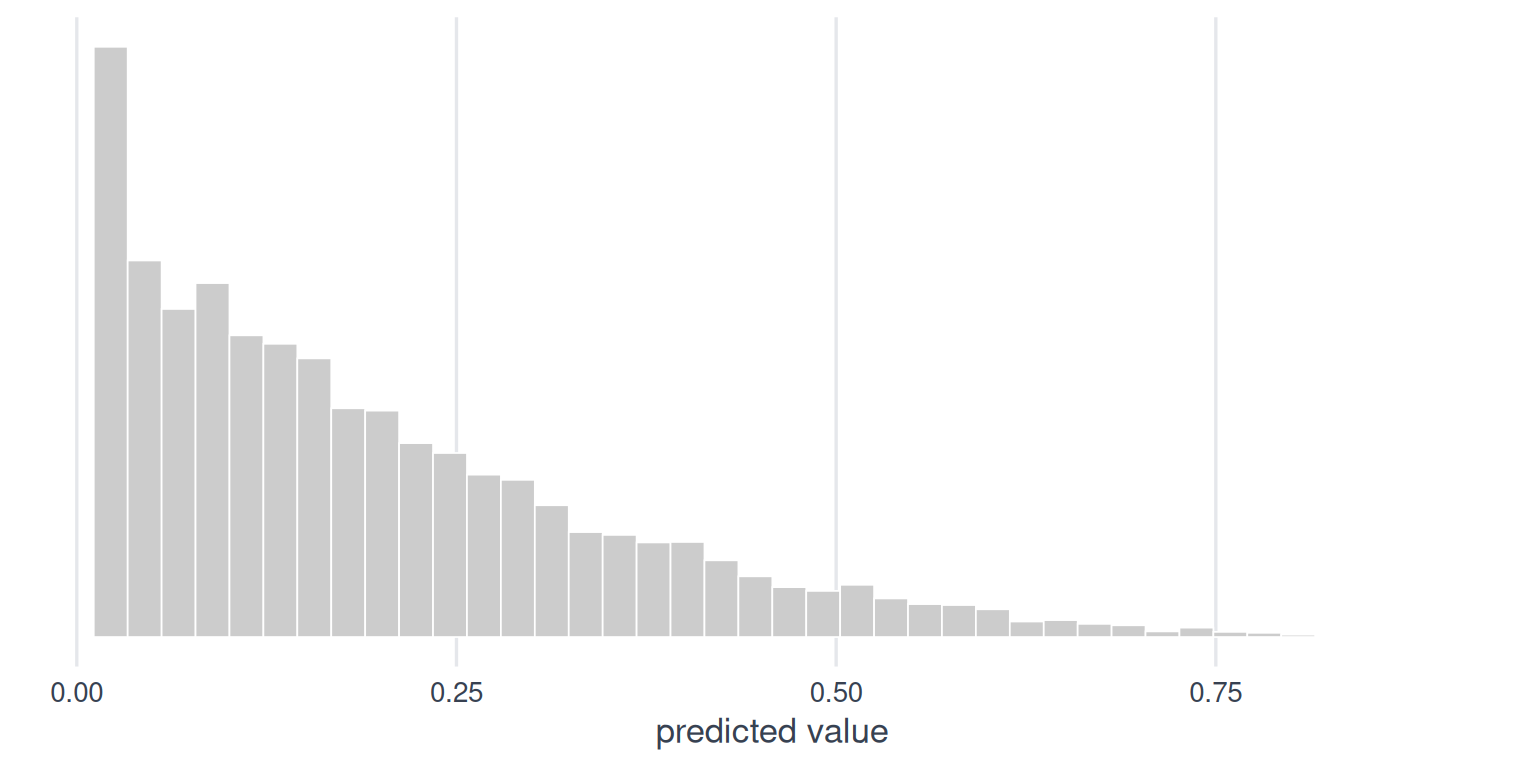
| statistic | value |
|---|---|
| mean | 0.19 |
| std dev | 0.16 |
| min | 0.03 |
| 25th | 0.09 |
| median | 0.13 |
| 75th | 0.24 |
| max | 0.99 |
Segments
| segment | lowest score | highest score | share of records |
|---|---|---|---|
| Most likely | 0.29 | 0.99 | 19.6% |
| Somewhat likely | 0.17 | 0.28 | 18.6% |
| Least likely | 0.03 | 0.16 | 61.9% |
External validity
Our model indicates that 19% of people with scored records are enrolled in Medicaid. CBO 2024 Medicaid baseline reports ~34M nonelderly nondisabled adults plus ~10M disabled adults plus ~6M dual-eligibles enrolled in Medicaid (~50M adults total / ~266M U.S. adults ≈ 19%). See also the KFF Medicaid Enrollment and Unwinding Tracker.