| metric | value |
|---|---|
| area under ROC curve | 0.67 |
| area under precision-recall curve | 0.76 |
| accuracy | 0.68 |
| precision | 0.70 |
| recall | 0.86 |
| f1 score | 0.77 |
| mean log loss | 0.61 |
| gini coefficient | 0.34 |
| brier skill score | 0.09 |
excessive costs: groceries
WarningStaging
Built from the latest training run on 2026-09-30 17:45 UTC, not from a released model set. The released documentation is at https://matter.indigo.engineering/docs/.
Overview
This model predicts whether a voter is experiencing excessive grocery costs — a felt-burden indicator combining direct reports of difficulty paying for groceries, an elevated grocery share of household expenses, and food-assistance program enrollment.
Trained on survey data, it uses income proxies, consumer indicators, and area-level cost-of-living features to identify voters feeling acute grocery cost pressure under current inflation conditions.
Organizations can apply these scores to target SNAP outreach, food affordability messaging, and anti-hunger campaigns.
- approach: deep learning
- training rows: 18,295
- last updated: 2026-08-27 21:17:43
Validation
Lift Chart
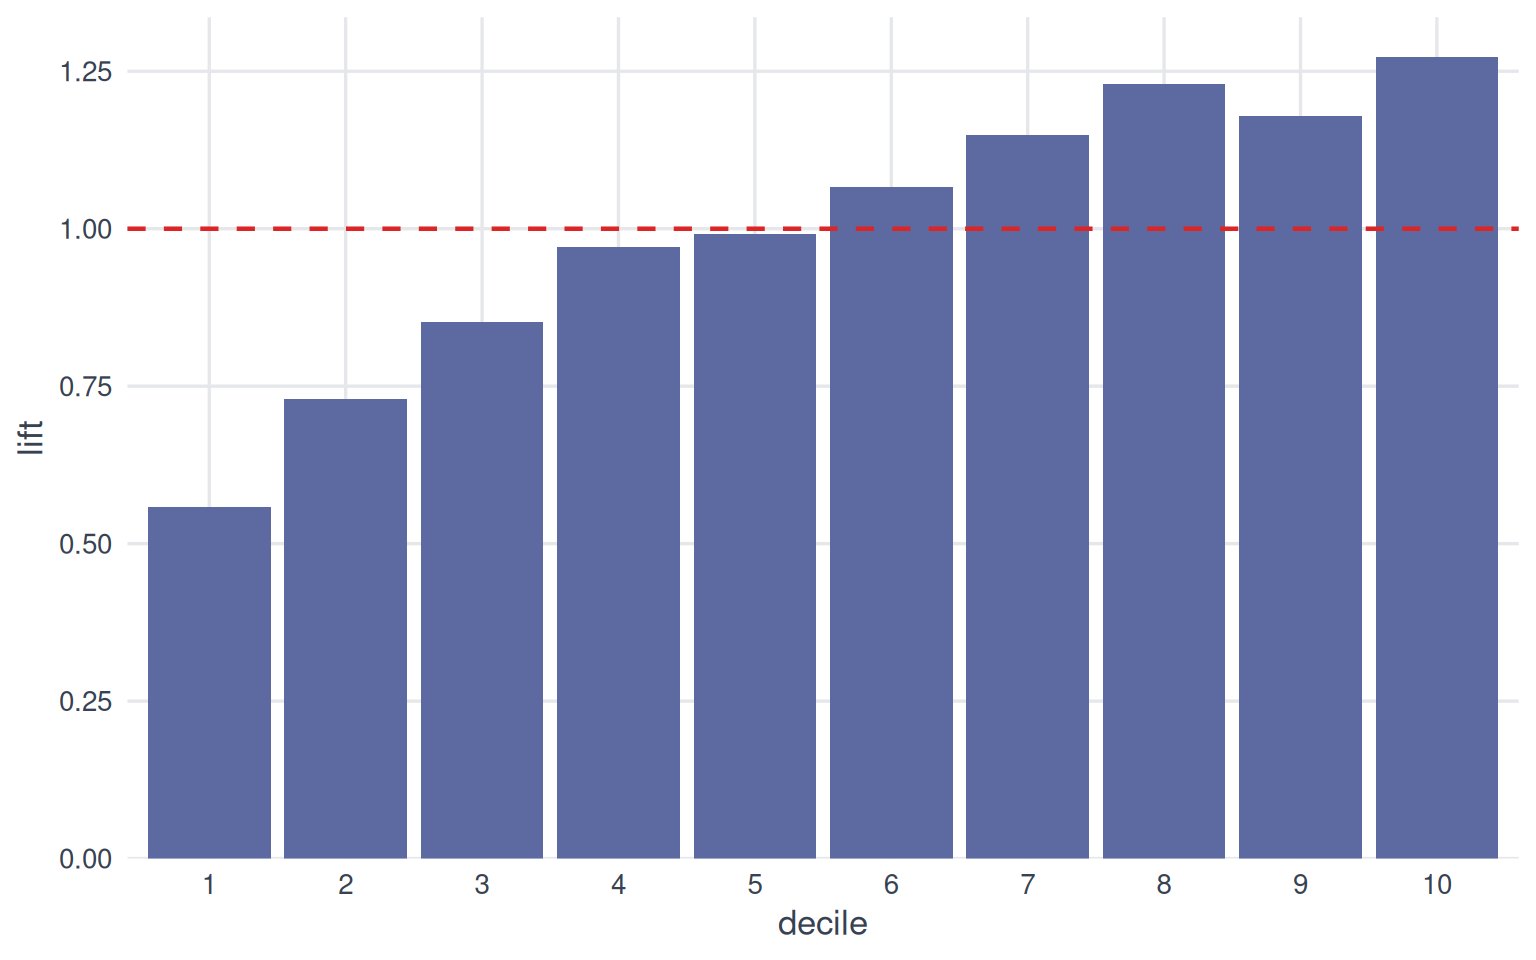
Each bar shows how much more common the outcome is within a score decile than in the population overall. Bars taller than the dashed line (lift of 1) mean the model’s top-ranked groups concentrate the outcome; a steady decline from decile 1 to 10 indicates the model is ranking effectively.
Calibration Plot
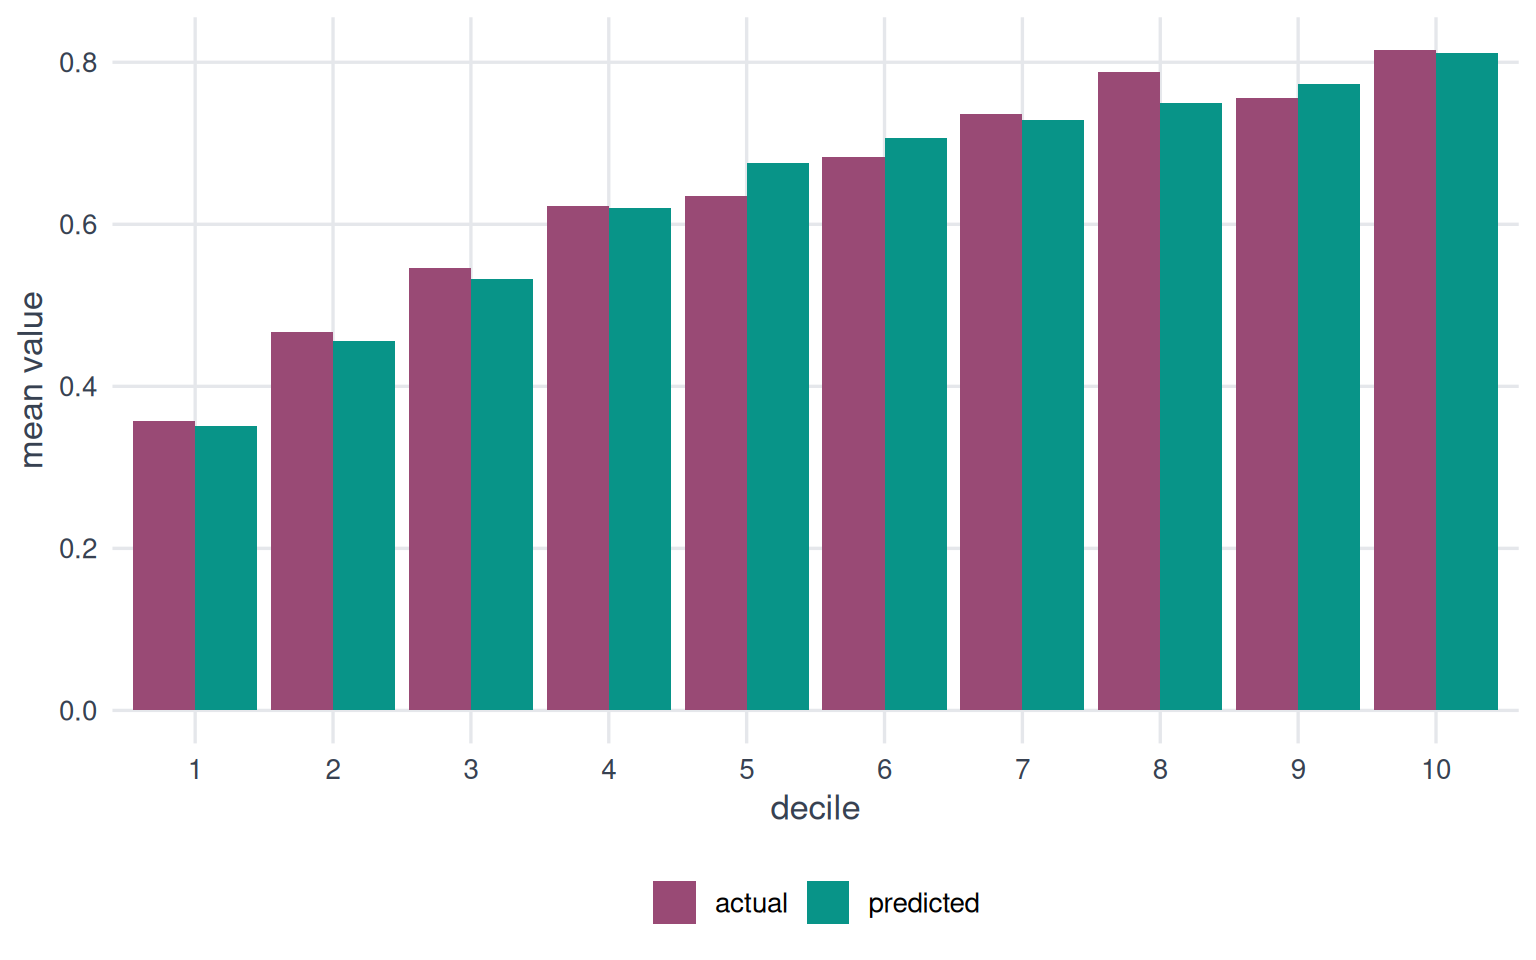
Bars of similar height within each decile indicate well-calibrated predictions. Systematic differences reveal where the model over- or under-predicts.
Cumulative Gains
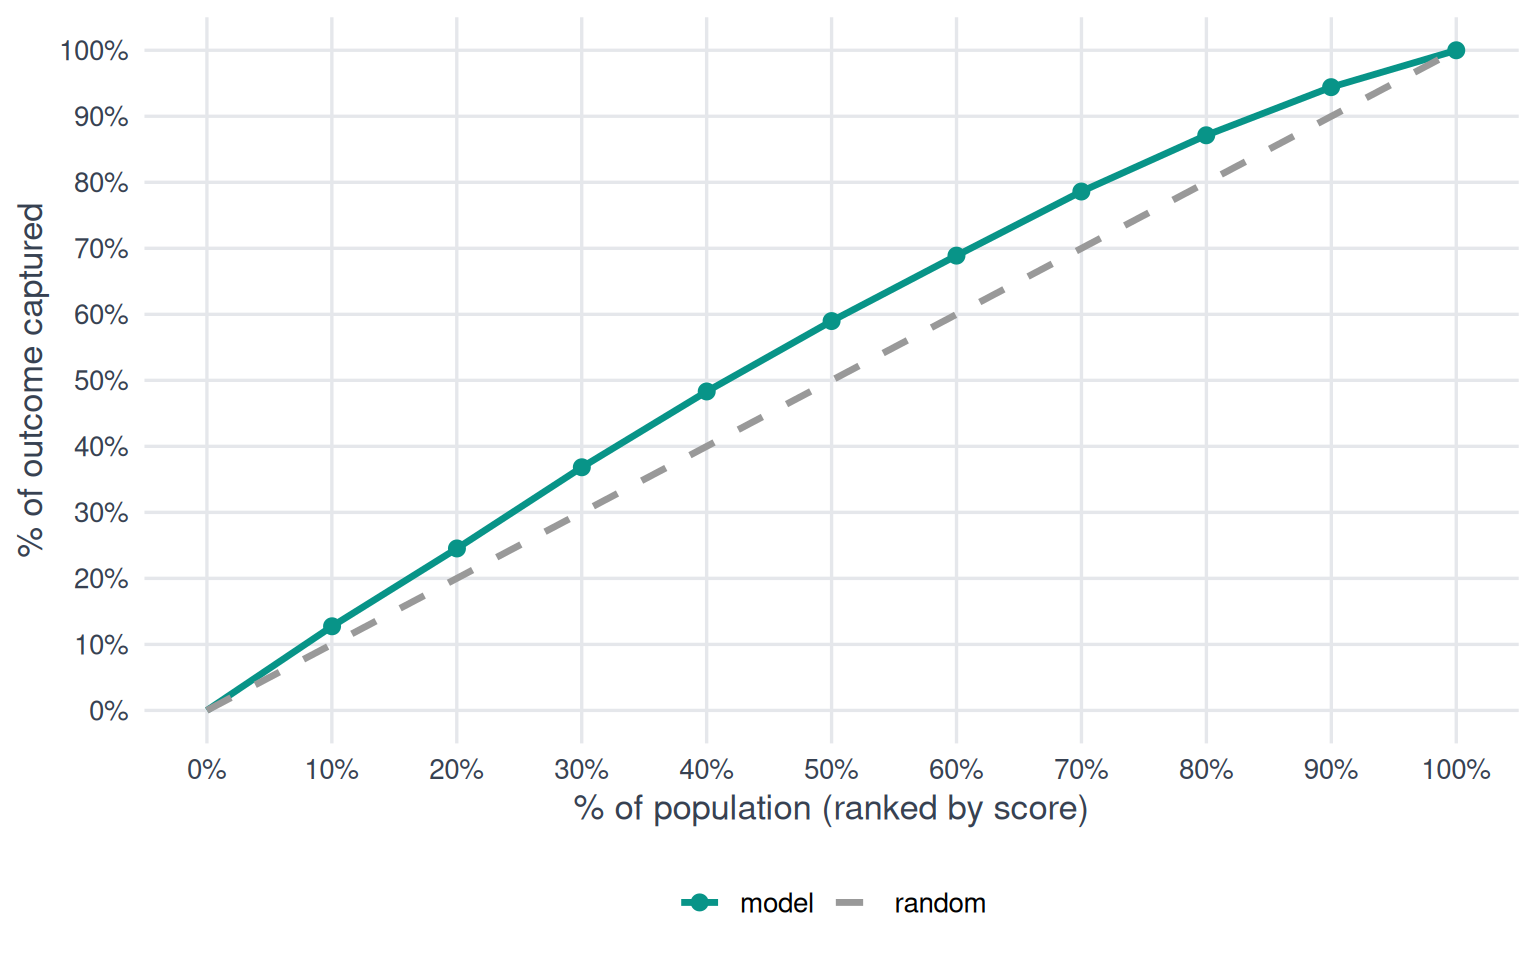
The further the model curve bows above the diagonal, the better the model concentrates the outcome in its top-ranked predictions.
Decile Analysis Table
| decile | count | mean actual | mean predicted | mae | lift |
|---|---|---|---|---|---|
| 10 | 459 | 0.81 | 0.81 | 0.003 | 1.27 |
| 9 | 458 | 0.76 | 0.77 | 0.02 | 1.18 |
| 8 | 458 | 0.79 | 0.75 | 0.04 | 1.23 |
| 7 | 458 | 0.74 | 0.73 | 0.007 | 1.15 |
| 6 | 458 | 0.68 | 0.71 | 0.02 | 1.07 |
| 5 | 458 | 0.64 | 0.68 | 0.04 | 0.99 |
| 4 | 458 | 0.62 | 0.62 | 0.002 | 0.97 |
| 3 | 458 | 0.55 | 0.53 | 0.01 | 0.85 |
| 2 | 458 | 0.47 | 0.46 | 0.01 | 0.73 |
| 1 | 459 | 0.36 | 0.35 | 0.007 | 0.56 |
Architecture
This model is a deep neural network trained with TensorFlow.
Network structure
| layer | units | activation |
|---|---|---|
| ↓ dense | 96 | relu |
| ↓ dropout (0.50 rate) | ||
| ↓ dense | 84 | relu |
| ↓ dropout (0.50 rate) | ||
| ↓ dense | 72 | relu |
| ↓ dropout (0.50 rate) | ||
| ↓ dense | 60 | relu |
| ↓ dropout (0.50 rate) | ||
| ↓ dense | 48 | relu |
| ↓ dropout (0.50 rate) | ||
| ↓ dense | 36 | relu |
Hyperparameter configuration
- loss: binary_focal_crossentropy
- optimizer: rmsprop
- batch size: 32
- activation: hard_sigmoid
- label smoothing: 0
- learning rate: 0.001
Features
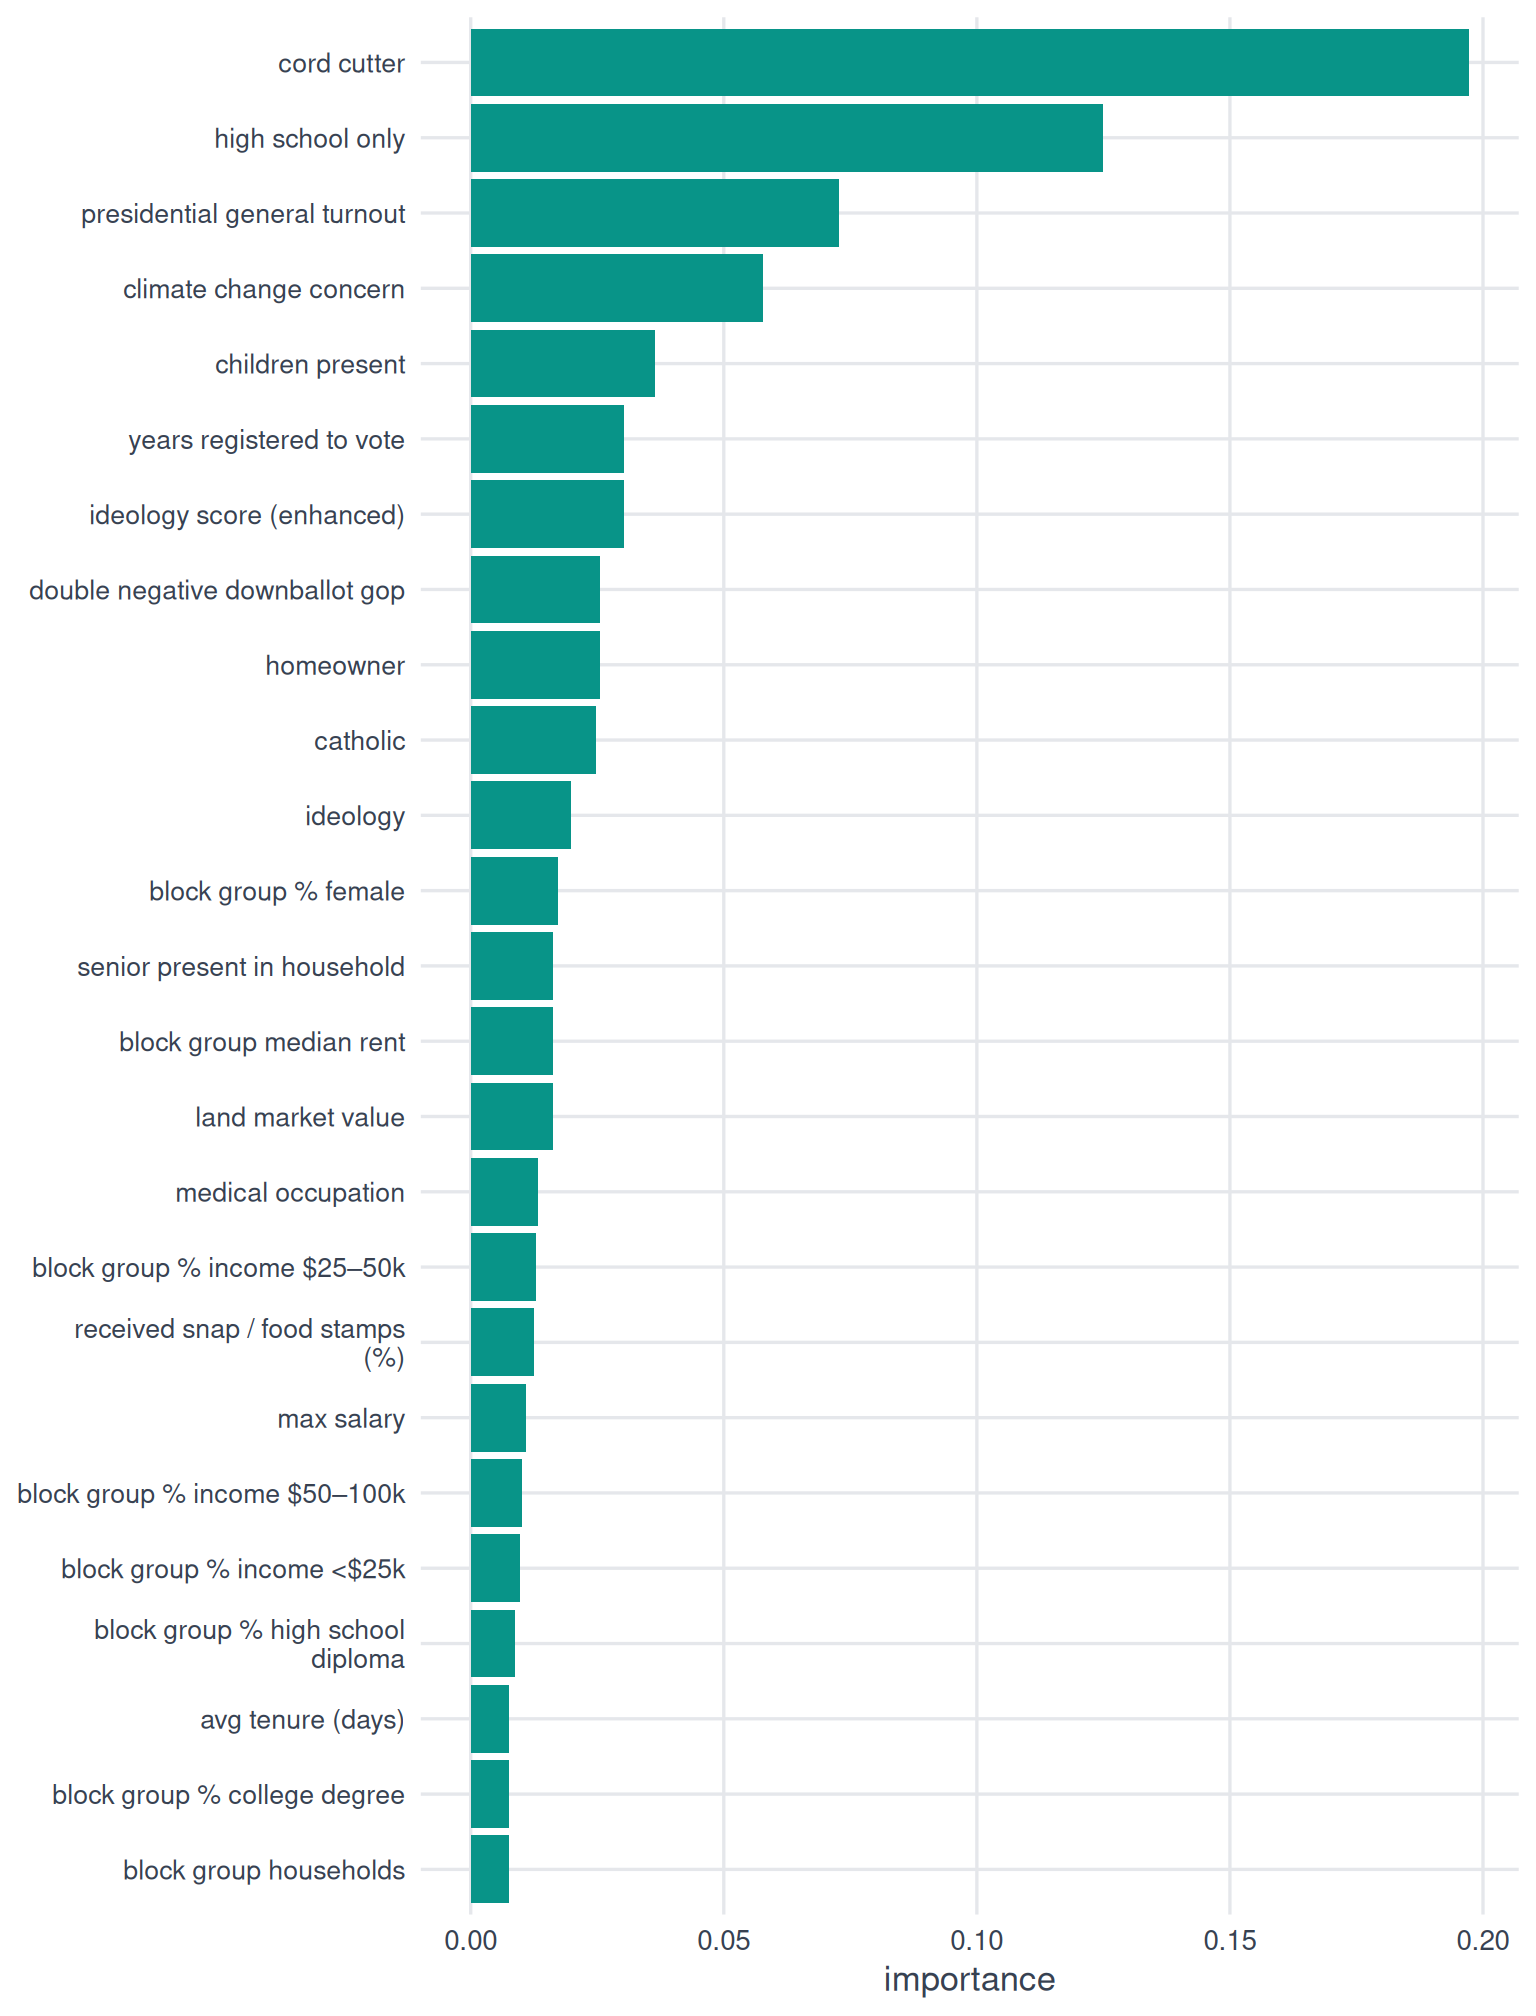
Importance
Sourcing
Agency for Healthcare Research and Quality
- received snap / food stamps (%)
Attom Property Data API
- land market value
Revelio Labs
- avg tenure (days)
- max salary
State voter files (via TargetSmart)
- years registered to vote
TargetSmart
- catholic score
- children present score
- climate change concern score
- cord cutter score
- double negative downballot gop score
- high school only score
- ideology score
- ideology score (enhanced)
- presidential general turnout score
U.S. Census American Community Survey
- block group % college degree
- block group % female
- block group % high school diploma
- block group % income <$25k
- block group % income $25–50k
- block group % income $50–100k
- block group households
- block group median rent
Verisk (via TargetSmart)
- homeowner
- medical occupation
- senior present in household
Implementation
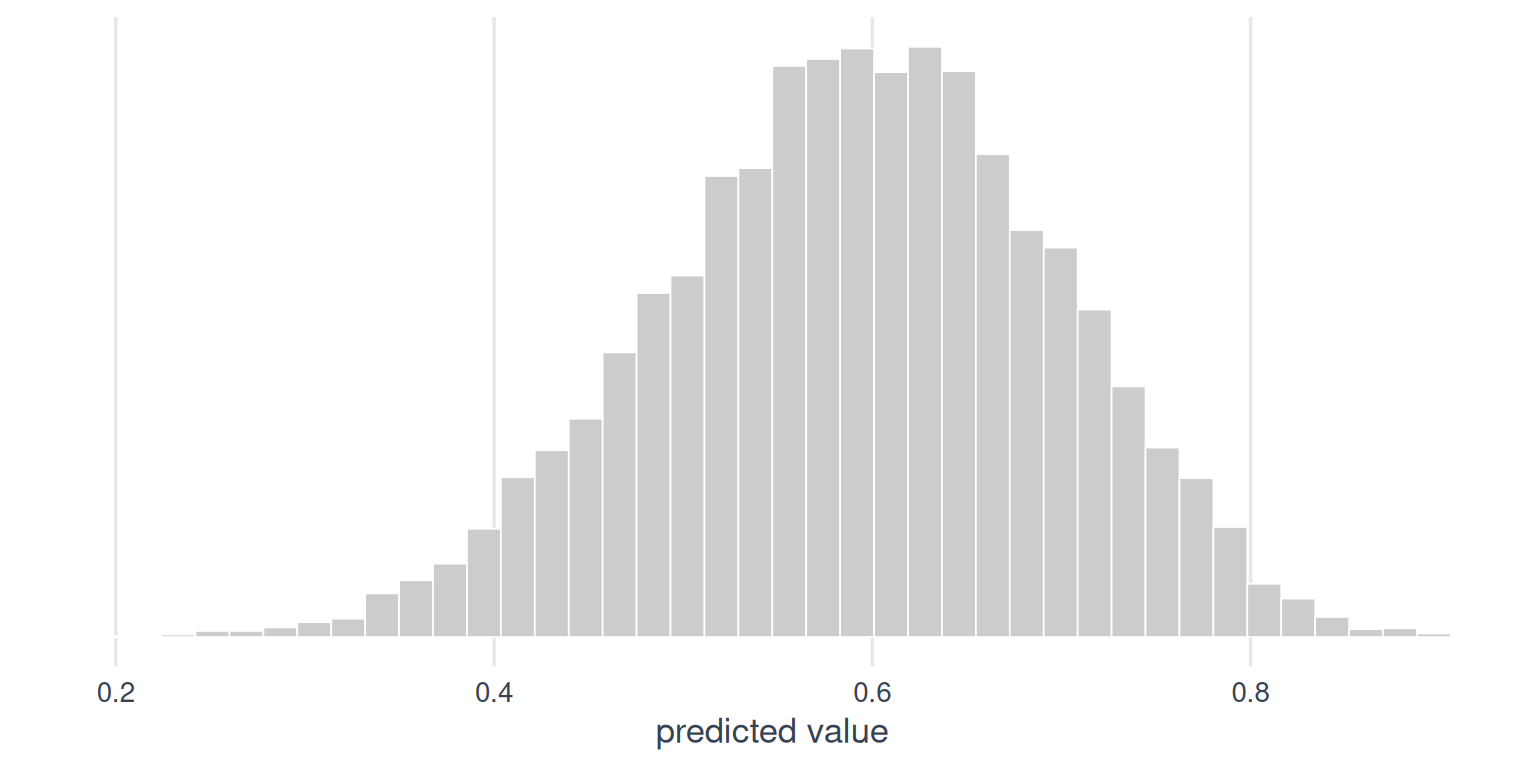
Prediction distribution
| statistic | value |
|---|---|
| mean | 0.59 |
| std dev | 0.10 |
| min | 0.14 |
| 25th | 0.53 |
| median | 0.60 |
| 75th | 0.67 |
| max | 0.91 |
Segments
| segment | lowest score | highest score | share of records |
|---|---|---|---|
| Most likely | 0.65 | 0.91 | 32.9% |
| Somewhat likely | 0.56 | 0.64 | 33.7% |
| Least likely | 0.14 | 0.55 | 33.4% |
External validity
Our model indicates that 59% of people with scored records report excessive grocery costs. For comparison, a 2026 survey by LendingTree found that 49% of Americans reported difficulty affording food, while a 2024 report by the USDA Economic Research Service indicated that 14% of US households had “low or very low food security.”