| metric | value |
|---|---|
| R² (correlation) | 0.48 |
| root mean squared error | 62,937 |
| mean absolute error | 32,799 |
| huber loss | 32,798 |
| gini coefficient | 0.65 |
income
WarningStaging
Built from the latest training run on 2026-09-30 17:45 UTC, not from a released model set. The released documentation is at https://matter.indigo.engineering/docs/.
Overview
This model estimates individual employment income as a continuous value.
Built as a boosted tree regressor on survey data, it integrates salary benchmarks, household indicators, voter registration history, and area-level economic context to produce income estimates.
These scores give organizations a more granular view of economic circumstances than census-tract averages alone, supporting targeted outreach around economic policy and financial assistance.
- approach: boosted tree regressor
- training rows: 5,309
- last updated: 2026-09-14 02:59:12
Validation
Lift Chart
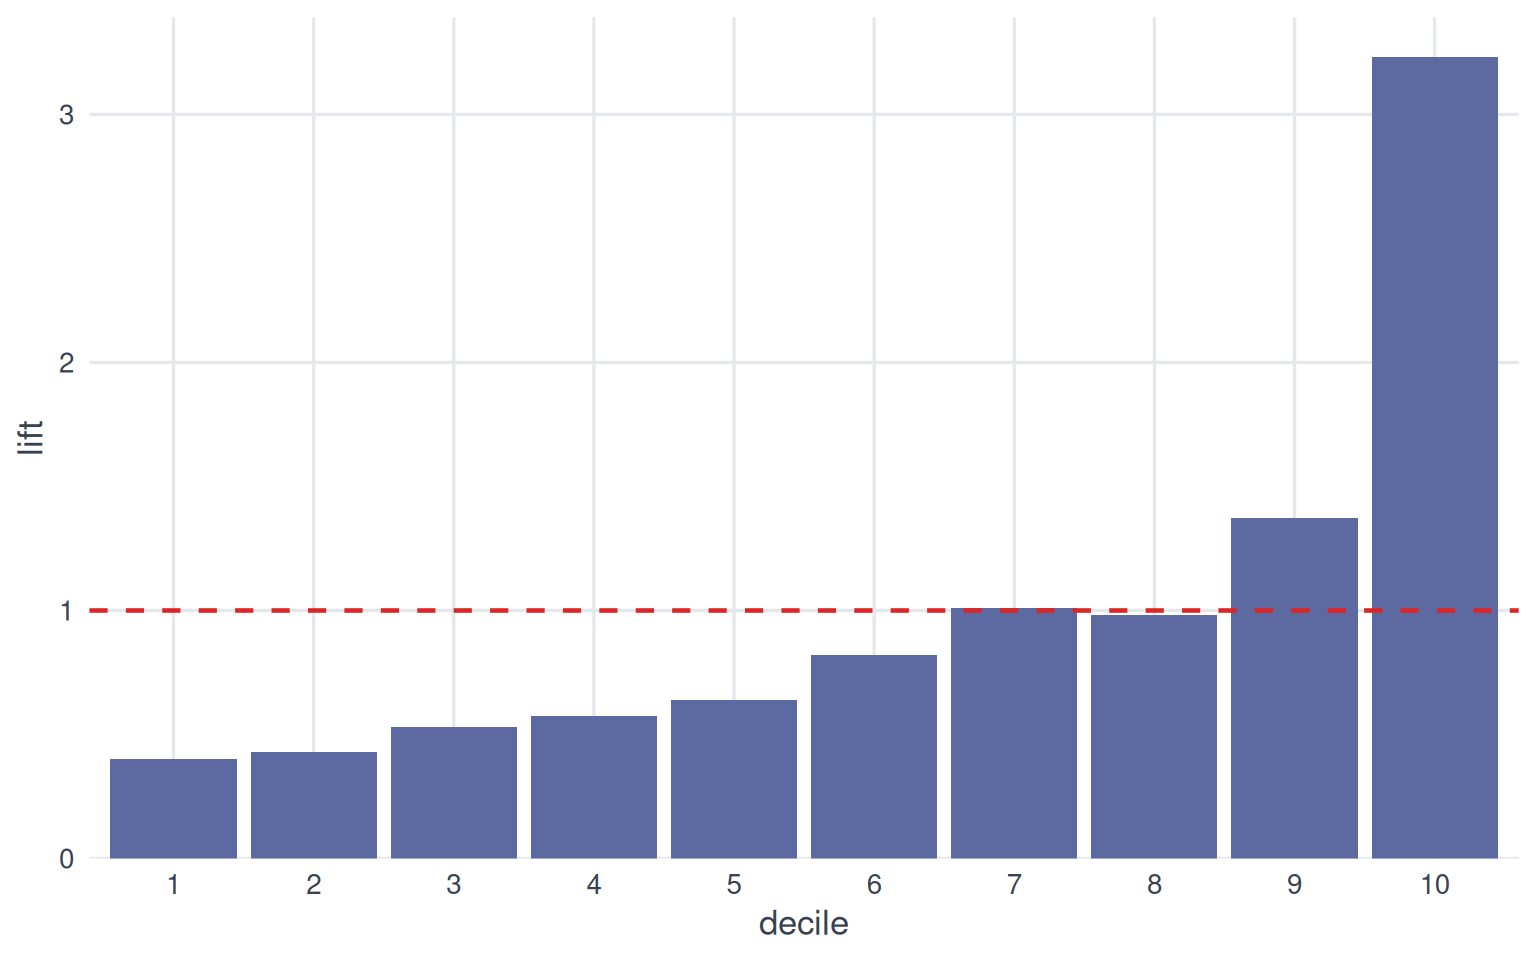
Each bar shows how much more common the outcome is within a score decile than in the population overall. Bars taller than the dashed line (lift of 1) mean the model’s top-ranked groups concentrate the outcome; a steady decline from decile 1 to 10 indicates the model is ranking effectively.
Calibration Plot
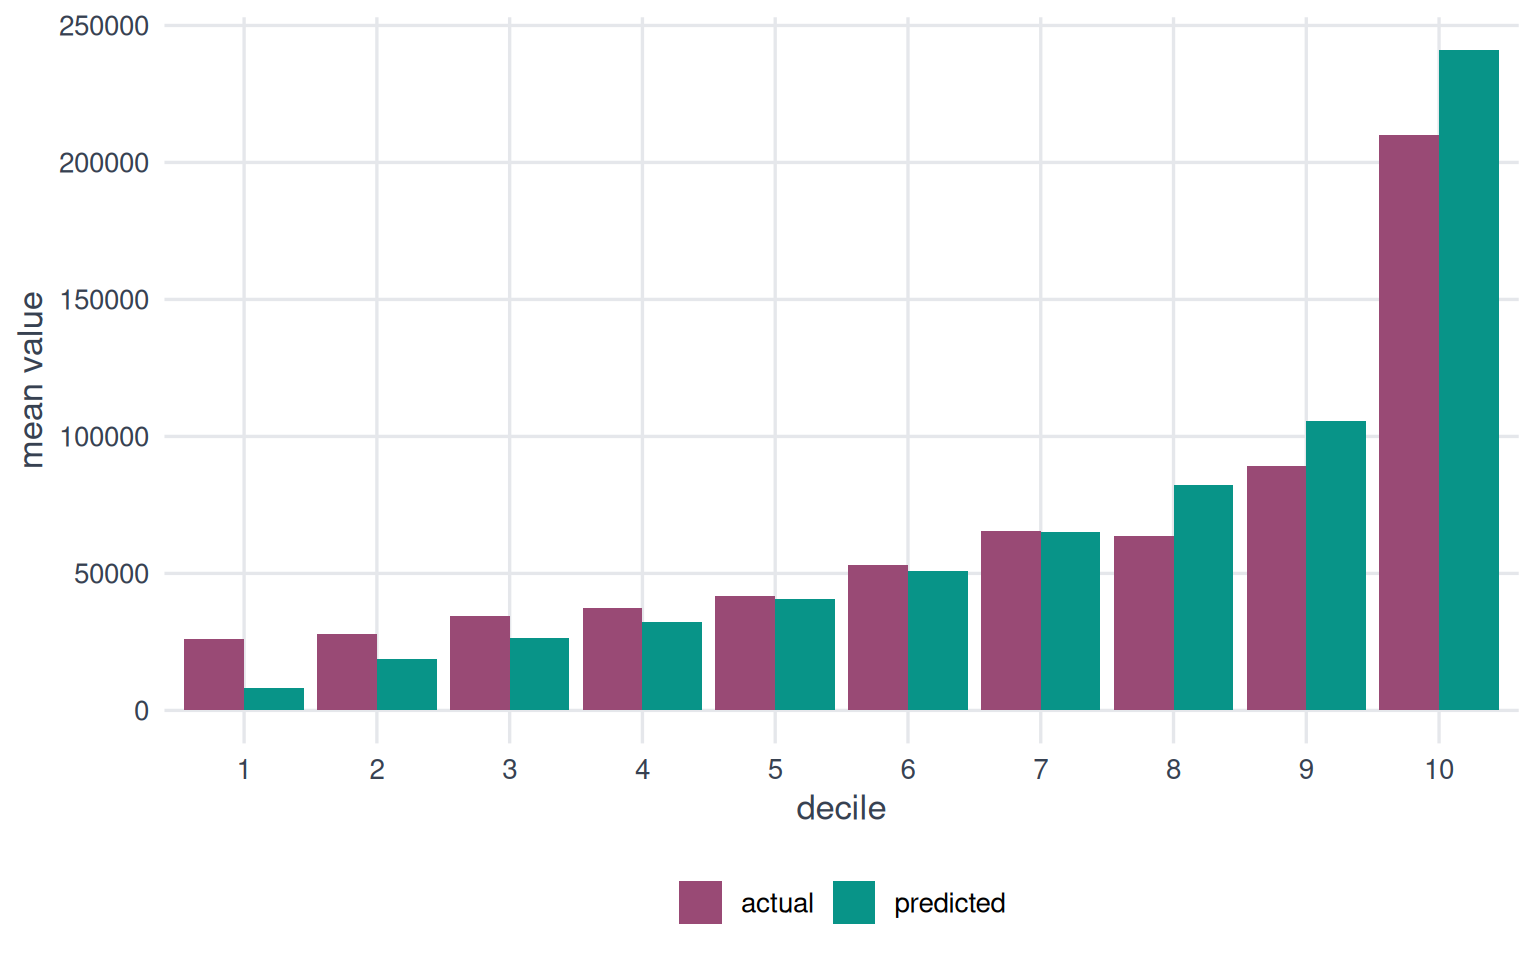
Bars of similar height within each decile indicate well-calibrated predictions. Systematic differences reveal where the model over- or under-predicts.
Cumulative Gains
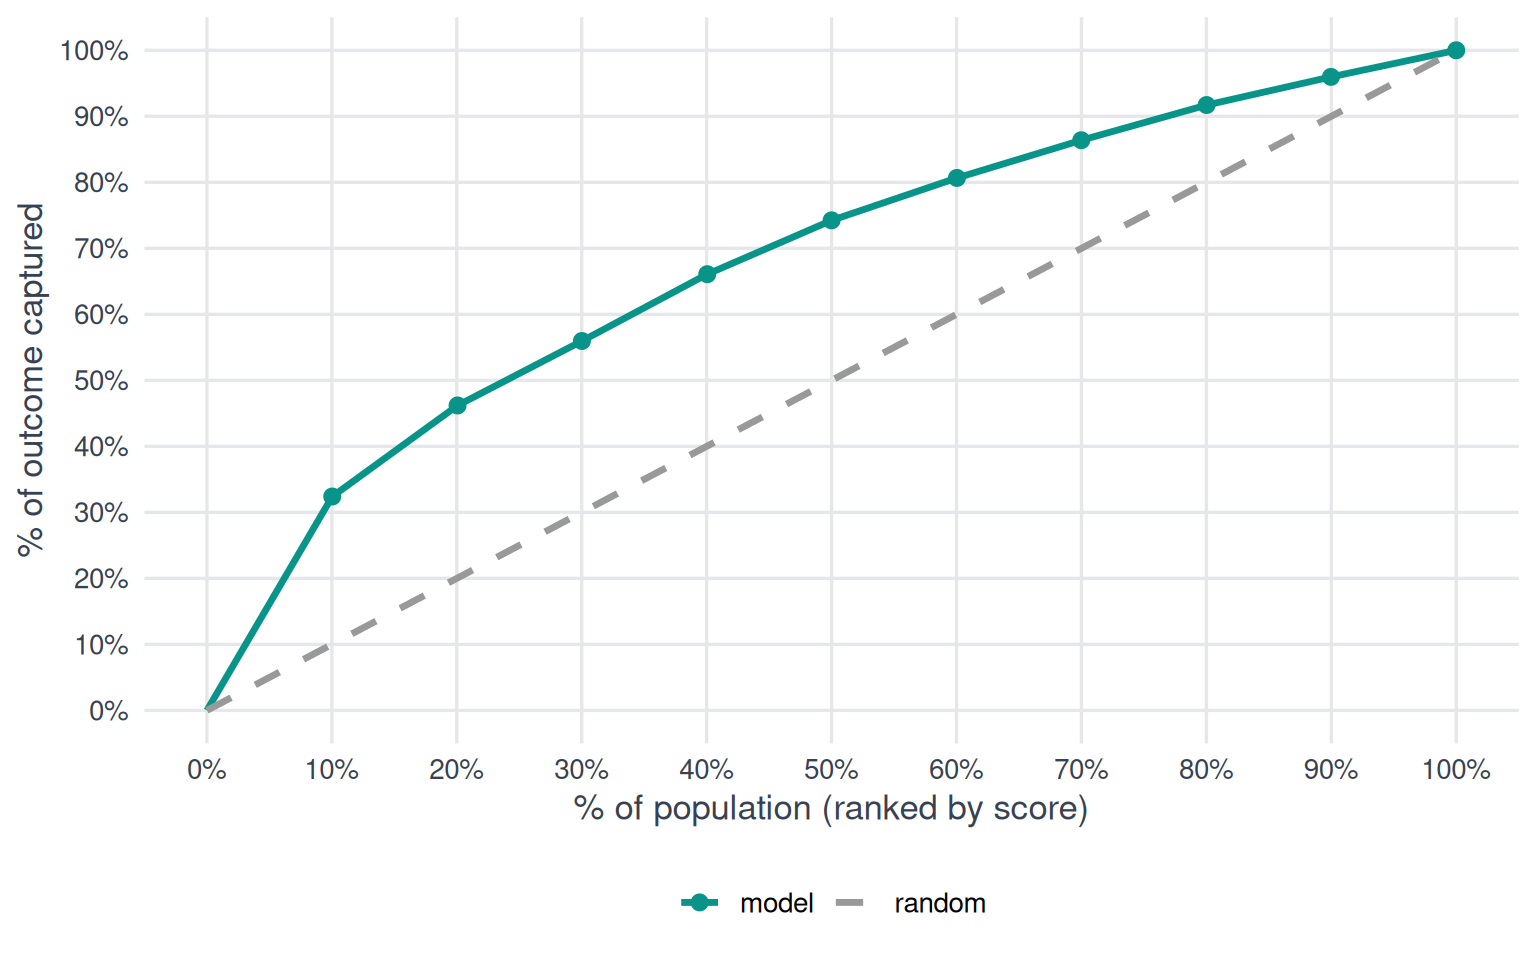
The further the model curve bows above the diagonal, the better the model concentrates the outcome in its top-ranked predictions.
Decile Analysis Table
| decile | count | mean actual | mean predicted | mae | lift |
|---|---|---|---|---|---|
| 10 | 129 | 209,846 | 240,942 | 31,095 | 3.23 |
| 9 | 129 | 89,317 | 105,516 | 16,199 | 1.37 |
| 8 | 128 | 63,746 | 82,112 | 18,366 | 0.98 |
| 7 | 129 | 65,547 | 65,024 | 523 | 1.01 |
| 6 | 128 | 53,242 | 51,026 | 2,216 | 0.82 |
| 5 | 129 | 41,609 | 40,698 | 911 | 0.64 |
| 4 | 128 | 37,285 | 32,271 | 5,014 | 0.57 |
| 3 | 129 | 34,516 | 26,464 | 8,051 | 0.53 |
| 2 | 128 | 27,832 | 18,872 | 8,960 | 0.43 |
| 1 | 129 | 26,124 | 8,059 | 18,065 | 0.40 |
Architecture
This model is a boosted-tree regressor trained with BigQuery ML.
Hyperparameter configuration
- max iterations: 20
- learn rate: 0.2938
- l1 regularization: 1.721e-09
- l2 regularization: 0.9959
- min relative progress: 0.01
- early stop: TRUE
- input label columns: employment_income
- data split method: AUTO_SPLIT
- max tree depth: 5
- subsample: 0.739
- min split loss: 0
- num trials: 12
- max parallel trials: 4
- hparam tuning objectives: R_SQUARED
- enable global explain: TRUE
- category encoding method: LABEL_ENCODING
- booster type: GBTREE
- num parallel tree: 1
- tree method: AUTO
- min tree child weight: 1
- instance weight column: sample_weight
- xgboost version: 0.9
Features
Importance
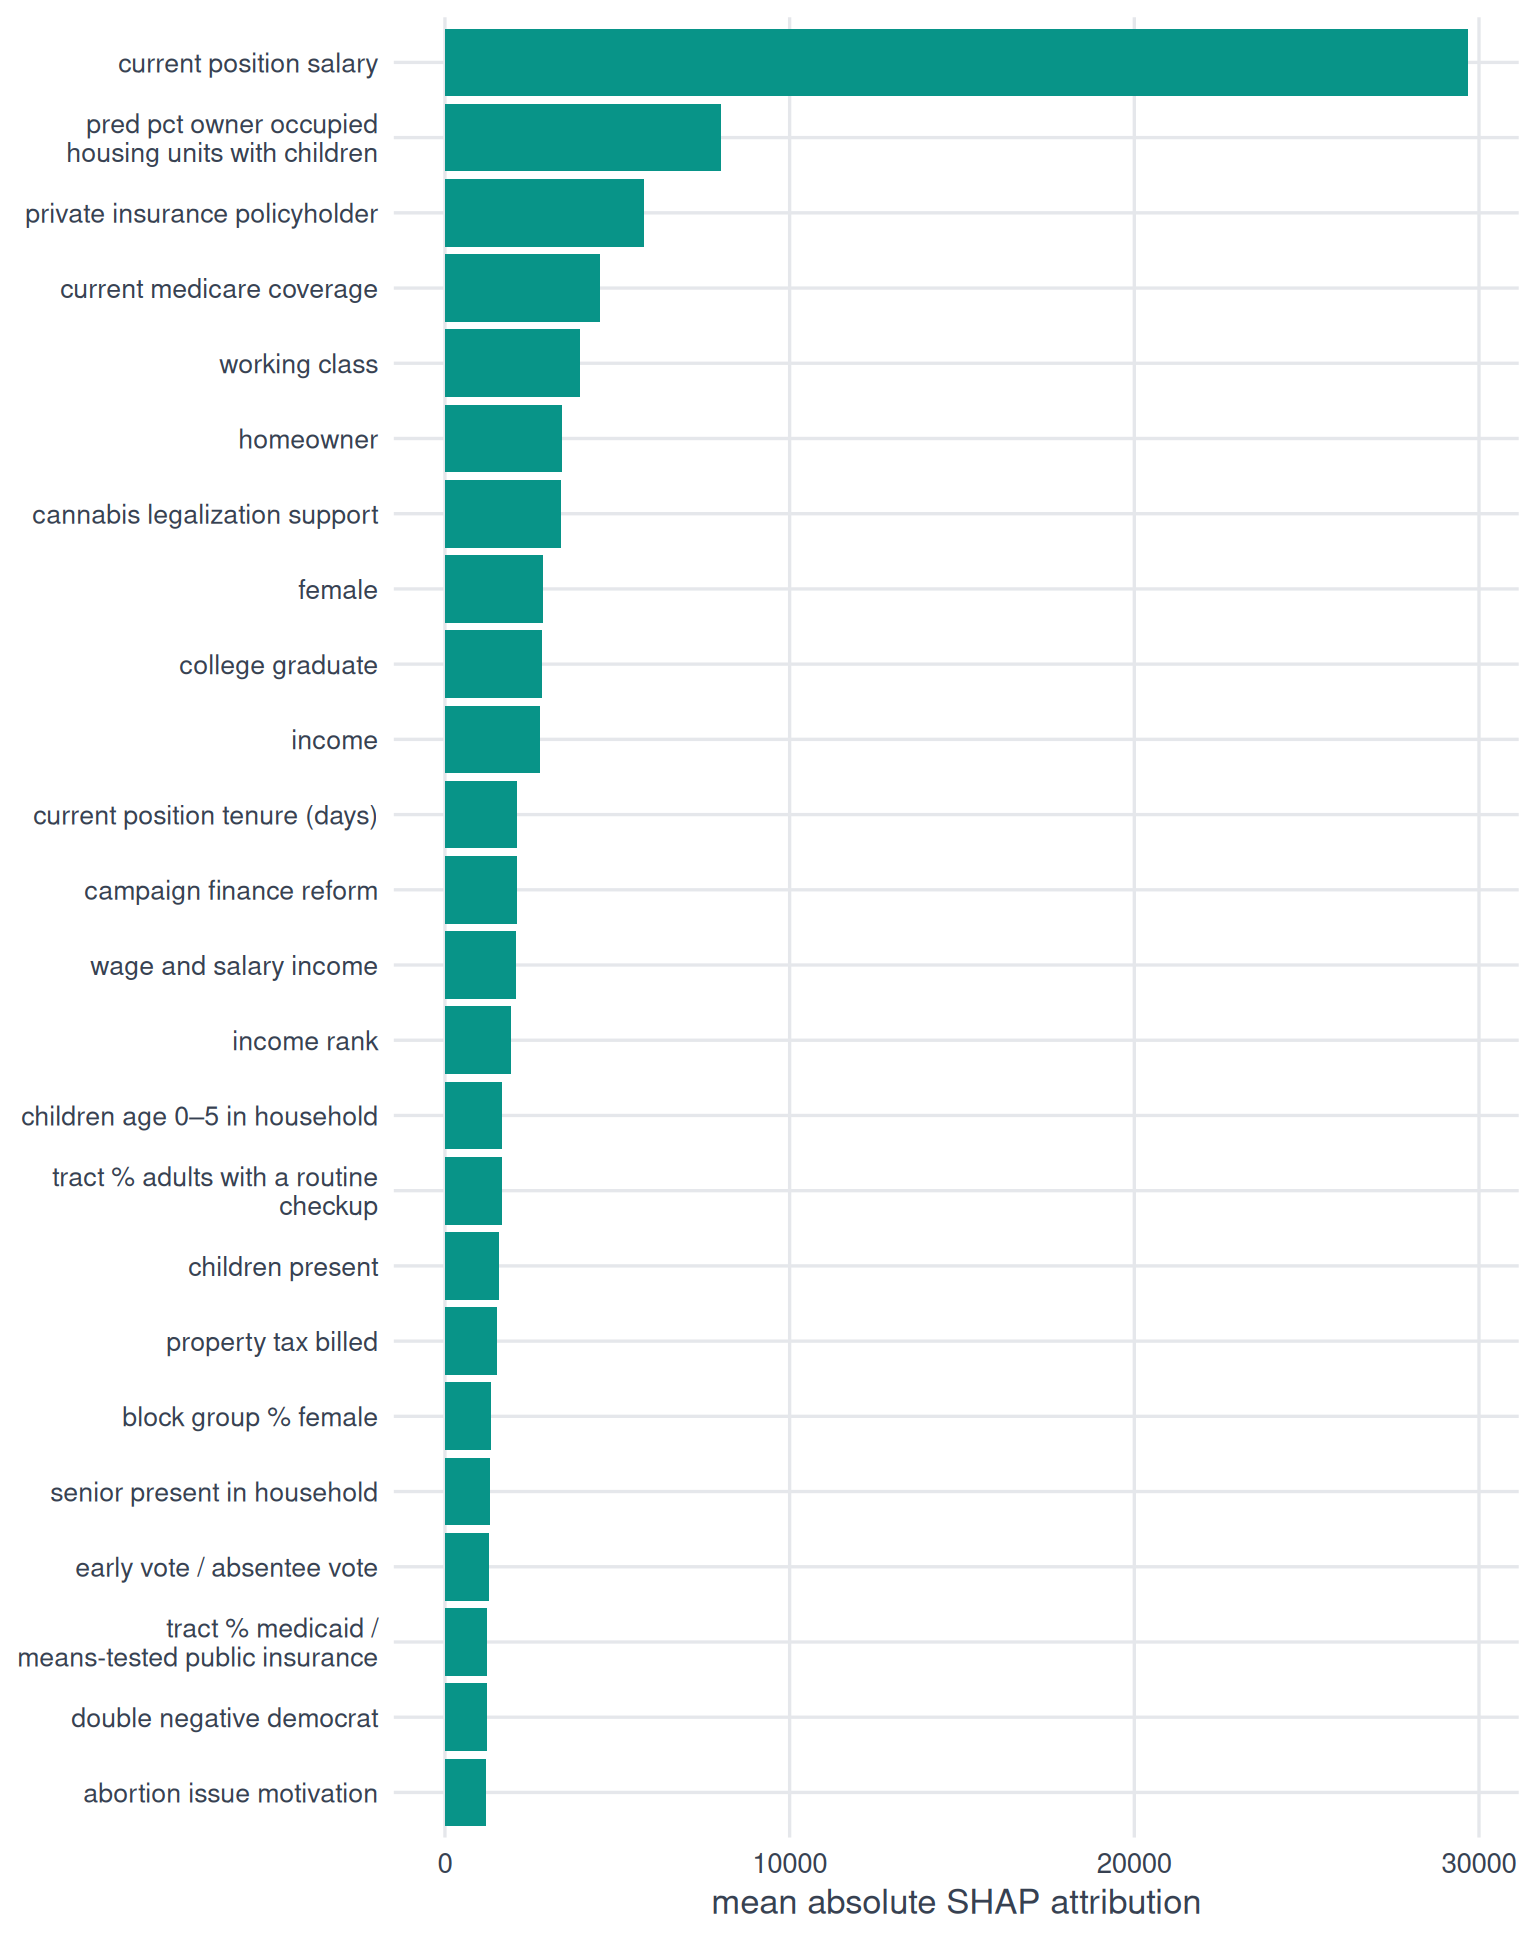
Interaction terms are split evenly between the features they combine.
Sourcing
Agency for Healthcare Research and Quality
- tract % medicaid / means-tested public insurance
Attom Property Data API
- property tax billed
CDC PLACES
- tract % adults with a routine checkup
Revelio Labs
- current position salary
- current position tenure (days)
State voter files (via TargetSmart)
- female
TargetSmart
- abortion issue motivation score
- campaign finance reform score
- cannabis legalization support score
- children present score
- college graduate score
- double negative democrat score
- early vote / absentee vote score
- homeowner score
- income rank
- working class score
U.S. Census American Community Survey
- block group % female
unknown
- pred pct owner occupied housing units with children
Verisk (via TargetSmart)
- children age 0–5 in household
- homeowner
- income
- senior present in household
Implementation
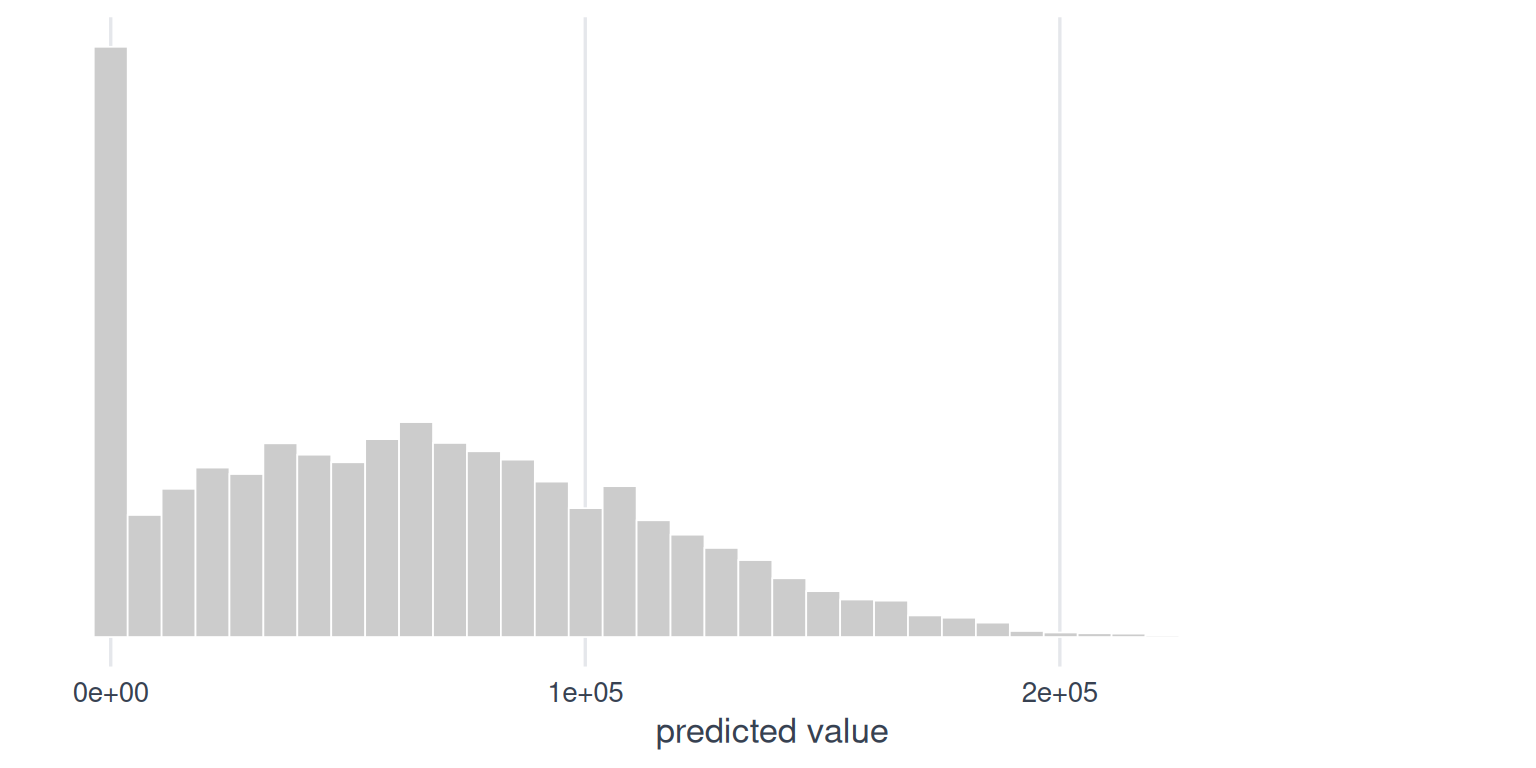
Prediction distribution
| statistic | value |
|---|---|
| mean | 58,102 |
| std dev | 54,827 |
| min | 0 |
| 25th | 30,355 |
| median | 50,287 |
| 75th | 74,365 |
| max | 1,196,183 |
External validity
Our model indicates an average annual employment income of $58,102 across scored person records. For 2024, FRED reports a median personal income of $45,140 and a mean personal income of $67,080 for U.S. residents age 15+ (inclusive of people not in the workforce).